

the Arctic Oscillation (AO), and its wintertime
index and pattern are very similar to that of the
NAO shown in Figure 7.3.2a. Both circulation
indices, therefore, account for much of the
observed pressure falls over the Arctic in recent
years (Walsh et al., 1996); the strengthening of the
subpolar westerlies from the surface of the North
Atlantic to the lower stratosphere (Thompson et
al., 2000); most of the surface warming over
Europe and Asia, as well as the cooling over the
northwest Atlantic, over the past 30 years (Hurrell, 1996; Thompson et al., 2000); pronounced
regional anomalies in precipitation (Hurrell,
1995a; Hurrell and van Loon, 1997; Dai et al.,
1997; Thompson et al., 2000); changes in storm
activity and a recent northward shift of the Atlantic
storm track (Hurrell, 1995b); and changes in within
season atmospheric variability such as blocking
(Nakamura, 1996b).
In order to place the recent extreme values of
the NAO into a longer-term perspective, Jones
et al. (1997) extended the wintertime record back
to the early 1820s using station data from Iceland
and Gibraltar and found that the amplitude of the
oscillation over the past 10 years is unprecedented.
Hurrell and van Loon (1997) showed that quasidecadal (6–10 year) variability has become more
pronounced over the latter half of this century,
SECTION 7 INSIGHTS FOR THE FUTURE
560
(a) NAO Index (Dec-Mar) 1964-1999
(c) Darwin SO Index (Monthly) 1882-1998
(b) NP Index (Nov-Mar) 1925-1998
(d) SH PC1 850 hPa Z (Annual) 1958-2000
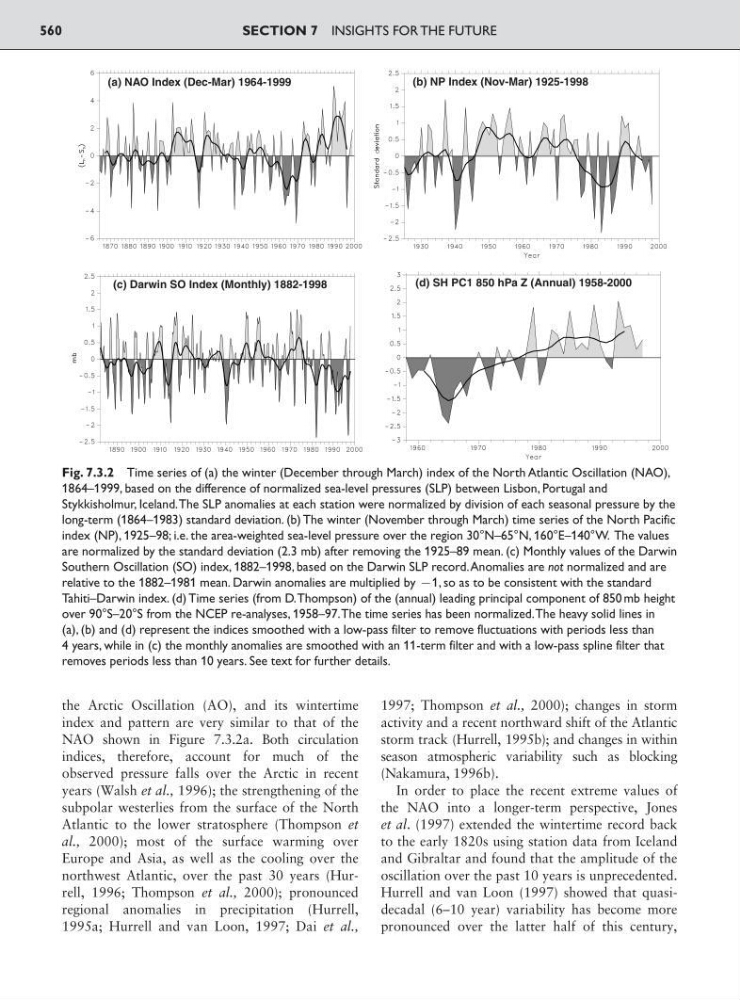
Fig. 7.3.2 Time series of (a) the winter (December through March) index of the North Atlantic Oscillation (NAO),
1864–1999, based on the difference of normalized sea-level pressures (SLP) between Lisbon, Portugal and
Stykkisholmur, Iceland.The SLP anomalies at each station were normalized by division of each seasonal pressure by the
long-term (1864–1983) standard deviation. (b) The winter (November through March) time series of the North Pacific
index (NP), 1925–98; i.e. the area-weighted sea-level pressure over the region 30°N–65°N, 160°E–140°W. The values
are normalized by the standard deviation (2.3 mb) after removing the 1925–89 mean. (c) Monthly values of the Darwin
Southern Oscillation (SO) index, 1882–1998, based on the Darwin SLP record.Anomalies are not normalized and are
relative to the 1882–1981 mean. Darwin anomalies are multiplied by 91, so as to be consistent with the standard
Tahiti–Darwin index. (d) Time series (from D.Thompson) of the (annual) leading principal component of 850 mb height
over 90°S–20°S from the NCEP re-analyses, 1958–97.The time series has been normalized.The heavy solid lines in
(a), (b) and (d) represent the indices smoothed with a low-pass filter to remove fluctuations with periods less than
4 years, while in (c) the monthly anomalies are smoothed with an 11-term filter and with a low-pass spline filter that
removes periods less than 10 years. See text for further details.
index and pattern are very similar to that of the
NAO shown in Figure 7.3.2a. Both circulation
indices, therefore, account for much of the
observed pressure falls over the Arctic in recent
years (Walsh et al., 1996); the strengthening of the
subpolar westerlies from the surface of the North
Atlantic to the lower stratosphere (Thompson et
al., 2000); most of the surface warming over
Europe and Asia, as well as the cooling over the
northwest Atlantic, over the past 30 years (Hurrell, 1996; Thompson et al., 2000); pronounced
regional anomalies in precipitation (Hurrell,
1995a; Hurrell and van Loon, 1997; Dai et al.,
1997; Thompson et al., 2000); changes in storm
activity and a recent northward shift of the Atlantic
storm track (Hurrell, 1995b); and changes in within
season atmospheric variability such as blocking
(Nakamura, 1996b).
In order to place the recent extreme values of
the NAO into a longer-term perspective, Jones
et al. (1997) extended the wintertime record back
to the early 1820s using station data from Iceland
and Gibraltar and found that the amplitude of the
oscillation over the past 10 years is unprecedented.
Hurrell and van Loon (1997) showed that quasidecadal (6–10 year) variability has become more
pronounced over the latter half of this century,
SECTION 7 INSIGHTS FOR THE FUTURE
560
(a) NAO Index (Dec-Mar) 1964-1999
(c) Darwin SO Index (Monthly) 1882-1998
(b) NP Index (Nov-Mar) 1925-1998
(d) SH PC1 850 hPa Z (Annual) 1958-2000
Fig. 7.3.2 Time series of (a) the winter (December through March) index of the North Atlantic Oscillation (NAO),
1864–1999, based on the difference of normalized sea-level pressures (SLP) between Lisbon, Portugal and
Stykkisholmur, Iceland.The SLP anomalies at each station were normalized by division of each seasonal pressure by the
long-term (1864–1983) standard deviation. (b) The winter (November through March) time series of the North Pacific
index (NP), 1925–98; i.e. the area-weighted sea-level pressure over the region 30°N–65°N, 160°E–140°W. The values
are normalized by the standard deviation (2.3 mb) after removing the 1925–89 mean. (c) Monthly values of the Darwin
Southern Oscillation (SO) index, 1882–1998, based on the Darwin SLP record.Anomalies are not normalized and are
relative to the 1882–1981 mean. Darwin anomalies are multiplied by 91, so as to be consistent with the standard
Tahiti–Darwin index. (d) Time series (from D.Thompson) of the (annual) leading principal component of 850 mb height
over 90°S–20°S from the NCEP re-analyses, 1958–97.The time series has been normalized.The heavy solid lines in
(a), (b) and (d) represent the indices smoothed with a low-pass filter to remove fluctuations with periods less than
4 years, while in (c) the monthly anomalies are smoothed with an 11-term filter and with a low-pass spline filter that
removes periods less than 10 years. See text for further details.