

Kuroshio and their eastward ‘extensions’. Their
importance to the general circulation is obvious,
but our assessment of their behaviour during
WOCE will necessarily be based more on indirect
than direct evidence.
In assessing the representativeness of the main
WOCE field phase (1990–97), we deliberately
include the Nordic Seas and Arctic Ocean, even
though these sea areas lay outside the WOCE survey grid. Our justification is that polar amplification and feedback are recurrent features of
numerical climate modelling, whose improvement
is the ultimate aim of WOCE; moreover it is now
demonstrable that Arctic change may feed south to
affect lower latitudes.
If we provide less-than-adequate coverage of
other important parameters or issues (notably the
sea surface temperature, expendable bathythermograph, sea level and remotely sensed data sets, the
higher frequencies of ocean–atmosphere variability, observation–model comparisons, etc.), this will
be understood to reflect the biases and inadequacies of the authorship rather than of WOCE. Some
of the inadequacies of this chapter will be met elsewhere in this volume.
7.3.2 The state of the atmosphere during
WOCE
7.3.2.1 Introduction
The atmospheric circulation during the WOCE
period of the 1990s was anomalous in several
respects. Over the Northern Hemisphere (NH), the
dominant patterns of atmospheric variability have
tended to remain in one phase such that Sea-Level
Pressure (SLP) has been lower than average over
the middle and high latitudes of the North Pacific
and North Atlantic oceans, as well as over much
of the Arctic, while it has been higher than average
over the subtropical oceans, especially the Atlantic
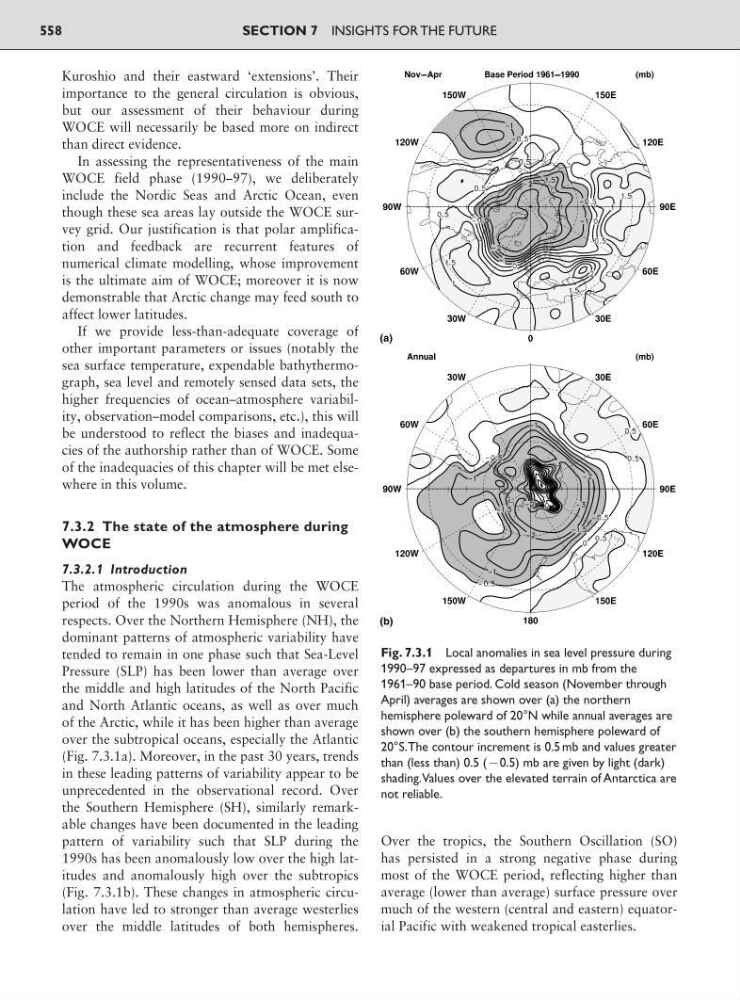
(Fig. 7.3.1a). Moreover, in the past 30 years, trends
in these leading patterns of variability appear to be
unprecedented in the observational record. Over
the Southern Hemisphere (SH), similarly remarkable changes have been documented in the leading
pattern of variability such that SLP during the
1990s has been anomalously low over the high latitudes and anomalously high over the subtropics
(Fig. 7.3.1b). These changes in atmospheric circulation have led to stronger than average westerlies
over the middle latitudes of both hemispheres.
Over the tropics, the Southern Oscillation (SO)
has persisted in a strong negative phase during
most of the WOCE period, reflecting higher than
average (lower than average) surface pressure over
much of the western (central and eastern) equatorial Pacific with weakened tropical easterlies.
SECTION 7 INSIGHTS FOR THE FUTURE
558
(a)
(b)
Fig. 7.3.1 Local anomalies in sea level pressure during
1990–97 expressed as departures in mb from the
1961–90 base period. Cold season (November through
April) averages are shown over (a) the northern
hemisphere poleward of 20°N while annual averages are
shown over (b) the southern hemisphere poleward of
20°S.The contour increment is 0.5 mb and values greater
than (less than) 0.5 (90.5) mb are given by light (dark)
shading.Values over the elevated terrain of Antarctica are
not reliable.
importance to the general circulation is obvious,
but our assessment of their behaviour during
WOCE will necessarily be based more on indirect
than direct evidence.
In assessing the representativeness of the main
WOCE field phase (1990–97), we deliberately
include the Nordic Seas and Arctic Ocean, even
though these sea areas lay outside the WOCE survey grid. Our justification is that polar amplification and feedback are recurrent features of
numerical climate modelling, whose improvement
is the ultimate aim of WOCE; moreover it is now
demonstrable that Arctic change may feed south to
affect lower latitudes.
If we provide less-than-adequate coverage of
other important parameters or issues (notably the
sea surface temperature, expendable bathythermograph, sea level and remotely sensed data sets, the
higher frequencies of ocean–atmosphere variability, observation–model comparisons, etc.), this will
be understood to reflect the biases and inadequacies of the authorship rather than of WOCE. Some
of the inadequacies of this chapter will be met elsewhere in this volume.
7.3.2 The state of the atmosphere during
WOCE
7.3.2.1 Introduction
The atmospheric circulation during the WOCE
period of the 1990s was anomalous in several
respects. Over the Northern Hemisphere (NH), the
dominant patterns of atmospheric variability have
tended to remain in one phase such that Sea-Level
Pressure (SLP) has been lower than average over
the middle and high latitudes of the North Pacific
and North Atlantic oceans, as well as over much
of the Arctic, while it has been higher than average
over the subtropical oceans, especially the Atlantic
(Fig. 7.3.1a). Moreover, in the past 30 years, trends
in these leading patterns of variability appear to be
unprecedented in the observational record. Over
the Southern Hemisphere (SH), similarly remarkable changes have been documented in the leading
pattern of variability such that SLP during the
1990s has been anomalously low over the high latitudes and anomalously high over the subtropics
(Fig. 7.3.1b). These changes in atmospheric circulation have led to stronger than average westerlies
over the middle latitudes of both hemispheres.
Over the tropics, the Southern Oscillation (SO)
has persisted in a strong negative phase during
most of the WOCE period, reflecting higher than
average (lower than average) surface pressure over
much of the western (central and eastern) equatorial Pacific with weakened tropical easterlies.
SECTION 7 INSIGHTS FOR THE FUTURE
558
(a)
(b)
Fig. 7.3.1 Local anomalies in sea level pressure during
1990–97 expressed as departures in mb from the
1961–90 base period. Cold season (November through
April) averages are shown over (a) the northern
hemisphere poleward of 20°N while annual averages are
shown over (b) the southern hemisphere poleward of
20°S.The contour increment is 0.5 mb and values greater
than (less than) 0.5 (90.5) mb are given by light (dark)
shading.Values over the elevated terrain of Antarctica are
not reliable.