

At seasonal to interannual time scales, variation
in the upper ocean structure of the tropical Pacific
was a central focus for the Tropical Ocean Global
Atmosphere (TOGA) programme. In other tropical and mid-latitude regions, WOCE data sets as
well as time series of hydrographic, XBT and surface data dating back several decades have been
used profitably to learn about these time scales. In
the North Pacific, the oceanic signature of the
decadal time scale has been clarified using the
XBT data set collected since the 1970s and continued in the 1990s as part of WOCE (Deser et al.,
1996 and Schneider et al., 1999b, showing the
subsurface propagation of temperature anomalies
around the subtropical gyre; Tourre et al., 1999,
describing the decadal cycle of temperature anomalies throughout the mid-latitudes).
The magnitude of the Indonesian Throughflow
is important qualitatively for the global thermohaline circulation and quantitatively for global heat
budgets. Several major field projects are placing
bounds on the transport, which has a large interannual range but which appears to average around
9 Sv through Makassar Strait with a range of 2.5 Sv
based on current meter measurements (Gordon and
Susanto, 1999; Gordon et al., 1999a). Transports
were minimum during an El Niño and maximum
during a La Niña during the limited observational
period. The Throughflow is estimated at 10–15 Sv
for all passages based on pressure gauge pairs
7.1 Towards a WOCE Synthesis
531
Talley, Stammer and Fukumori
-2
-1
0
1
2
1940
1950
1960
1970
1980
1990
2000
(d) SHPC
1940
1950
1960
1970
1980
1990
2000
-1
0
1
(c) TAGI
-5
0
5
(b) NAO
-4
-2
0
2
4
1940
1950
1960
1970
1980
1990
2000 1940
1950
1960
1970
1980
1990
2000
(a) AO
-2
-1
0
1
2
(e) PDO
-20
-10
0
10
20 (f) SOI
-4
-2
0
2
4
(g) DMI
-4
-2
0
2
(h) SDMI
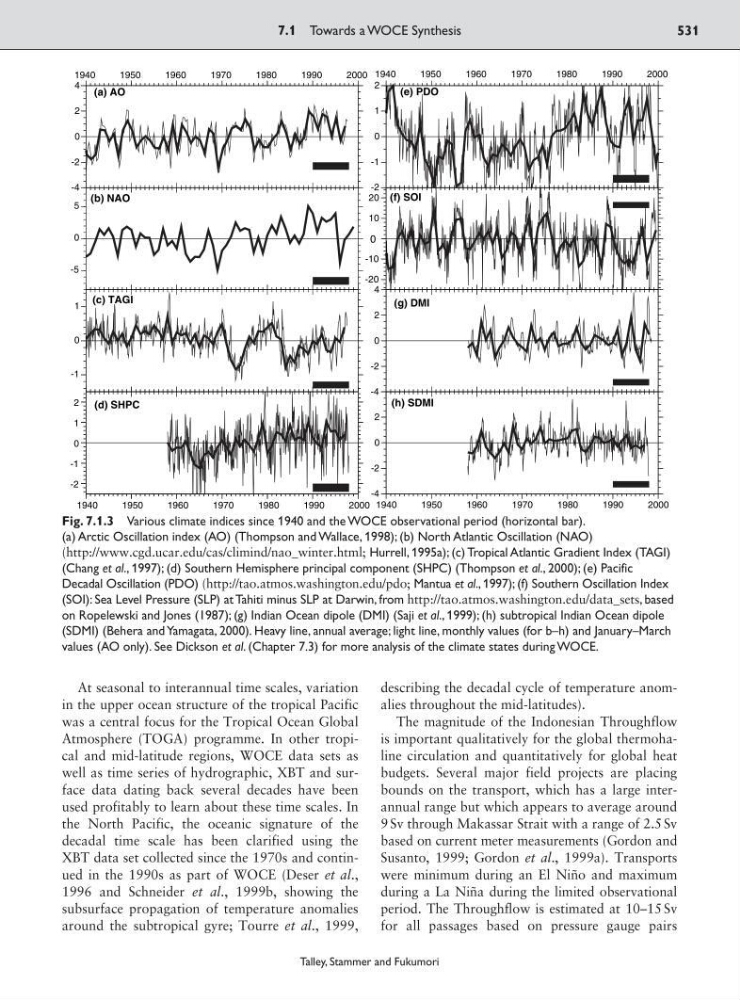
Fig. 7.1.3 Various climate indices since 1940 and the WOCE observational period (horizontal bar).
(a) Arctic Oscillation index (AO) (Thompson and Wallace, 1998); (b) North Atlantic Oscillation (NAO)
(http://www.cgd.ucar.edu/cas/climind/nao_winter.html; Hurrell, 1995a); (c) Tropical Atlantic Gradient Index (TAGI)
(Chang et al., 1997); (d) Southern Hemisphere principal component (SHPC) (Thompson et al., 2000); (e) Pacific
Decadal Oscillation (PDO) (http://tao.atmos.washington.edu/pdo; Mantua et al., 1997); (f) Southern Oscillation Index
(SOI): Sea Level Pressure (SLP) at Tahiti minus SLP at Darwin, from http://tao.atmos.washington.edu/data_sets, based
on Ropelewski and Jones (1987); (g) Indian Ocean dipole (DMI) (Saji et al., 1999); (h) subtropical Indian Ocean dipole
(SDMI) (Behera and Yamagata, 2000). Heavy line, annual average; light line, monthly values (for b–h) and January–March
values (AO only). See Dickson et al. (Chapter 7.3) for more analysis of the climate states during WOCE.
in the upper ocean structure of the tropical Pacific
was a central focus for the Tropical Ocean Global
Atmosphere (TOGA) programme. In other tropical and mid-latitude regions, WOCE data sets as
well as time series of hydrographic, XBT and surface data dating back several decades have been
used profitably to learn about these time scales. In
the North Pacific, the oceanic signature of the
decadal time scale has been clarified using the
XBT data set collected since the 1970s and continued in the 1990s as part of WOCE (Deser et al.,
1996 and Schneider et al., 1999b, showing the
subsurface propagation of temperature anomalies
around the subtropical gyre; Tourre et al., 1999,
describing the decadal cycle of temperature anomalies throughout the mid-latitudes).
The magnitude of the Indonesian Throughflow
is important qualitatively for the global thermohaline circulation and quantitatively for global heat
budgets. Several major field projects are placing
bounds on the transport, which has a large interannual range but which appears to average around
9 Sv through Makassar Strait with a range of 2.5 Sv
based on current meter measurements (Gordon and
Susanto, 1999; Gordon et al., 1999a). Transports
were minimum during an El Niño and maximum
during a La Niña during the limited observational
period. The Throughflow is estimated at 10–15 Sv
for all passages based on pressure gauge pairs
7.1 Towards a WOCE Synthesis
531
Talley, Stammer and Fukumori
-2
-1
0
1
2
1940
1950
1960
1970
1980
1990
2000
(d) SHPC
1940
1950
1960
1970
1980
1990
2000
-1
0
1
(c) TAGI
-5
0
5
(b) NAO
-4
-2
0
2
4
1940
1950
1960
1970
1980
1990
2000 1940
1950
1960
1970
1980
1990
2000
(a) AO
-2
-1
0
1
2
(e) PDO
-20
-10
0
10
20 (f) SOI
-4
-2
0
2
4
(g) DMI
-4
-2
0
2
(h) SDMI
Fig. 7.1.3 Various climate indices since 1940 and the WOCE observational period (horizontal bar).
(a) Arctic Oscillation index (AO) (Thompson and Wallace, 1998); (b) North Atlantic Oscillation (NAO)
(http://www.cgd.ucar.edu/cas/climind/nao_winter.html; Hurrell, 1995a); (c) Tropical Atlantic Gradient Index (TAGI)
(Chang et al., 1997); (d) Southern Hemisphere principal component (SHPC) (Thompson et al., 2000); (e) Pacific
Decadal Oscillation (PDO) (http://tao.atmos.washington.edu/pdo; Mantua et al., 1997); (f) Southern Oscillation Index
(SOI): Sea Level Pressure (SLP) at Tahiti minus SLP at Darwin, from http://tao.atmos.washington.edu/data_sets, based
on Ropelewski and Jones (1987); (g) Indian Ocean dipole (DMI) (Saji et al., 1999); (h) subtropical Indian Ocean dipole
(SDMI) (Behera and Yamagata, 2000). Heavy line, annual average; light line, monthly values (for b–h) and January–March
values (AO only). See Dickson et al. (Chapter 7.3) for more analysis of the climate states during WOCE.