

SECTION 6 LARGE-SCALE OCEAN TRANSPORTS
506
TCO 2 (μmol kg
–1 )
2100
2200
2300
Depth (m)
0
1000
2000
3000
4000
5000
pCO 2 (μatm)
250
300
350
0
100
200
300
0
1 0
1 5
Atmospheric Time Histories
0
100
200
300
pCO (μatm)
2
280
300
320
340
360
TCO
2
2
TCO 2
TCO 2
0
0
pCCl 4
(exp)
(exp)
pCFC-11
pCFC-11
pCCl 4
CCl 4
vs
CO 2
CFC-11
vs
CO 2
(a)
(c)
(b)
pCO
(meas)
(AOU-corr)
Equivalent Atmospheric Levels
pCCl 4 , pCFC-11 (x 10
–12 atm)
5
pCCl 4 , pCFC-11 (x 10
–12 atm)
(expanded scale)
pCCl 4 , pCFC-11 (x 10
-12 atm)
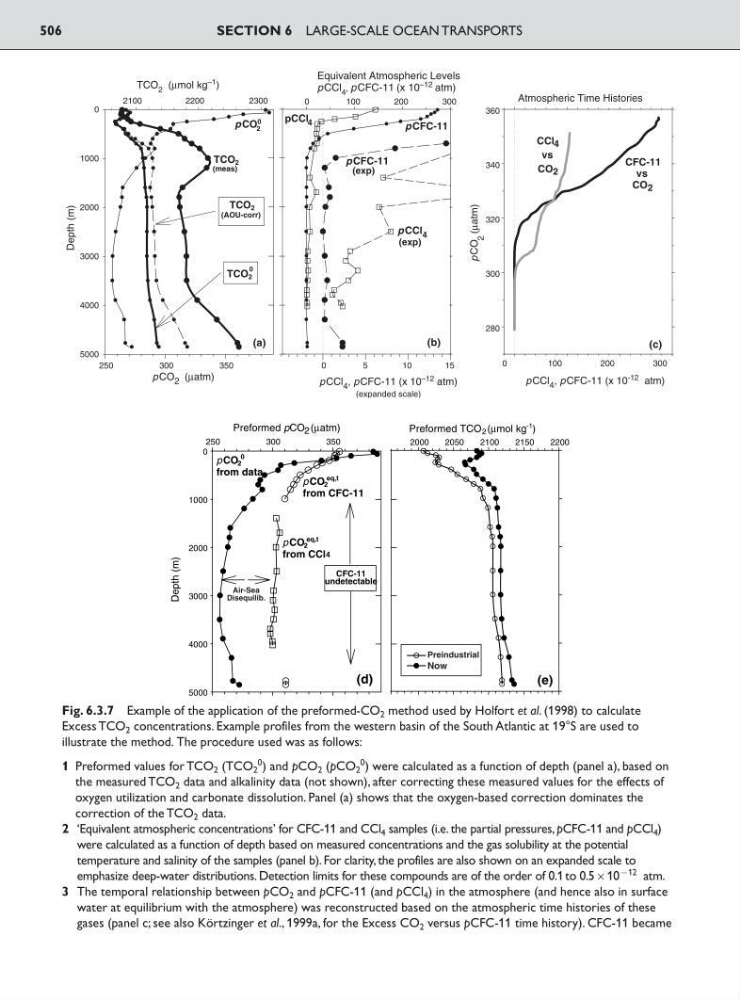
Fig. 6.3.7 Example of the application of the preformed-CO 2 method used by Holfort et al. (1998) to calculate
Excess TCO 2 concentrations. Example profiles from the western basin of the South Atlantic at 19°S are used to
illustrate the method. The procedure used was as follows:
1 Preformed values for TCO 2 (TCO 2
0 ) and pCO 2 (pCO 2
0
) were calculated as a function of depth (panel a), based on
the measured TCO 2 data and alkalinity data (not shown), after correcting these measured values for the effects of
oxygen utilization and carbonate dissolution. Panel (a) shows that the oxygen-based correction dominates the
correction of the TCO 2 data.
2 ‘Equivalent atmospheric concentrations’ for CFC-11 and CCl 4 samples (i.e. the partial pressures, pCFC-11 and pCCl 4 )
were calculated as a function of depth based on measured concentrations and the gas solubility at the potential
temperature and salinity of the samples (panel b). For clarity, the profiles are also shown on an expanded scale to
emphasize deep-water distributions. Detection limits for these compounds are of the order of 0.1 to 0.510
912 atm.
3 The temporal relationship between pCO 2 and pCFC-11 (and pCCl 4 ) in the atmosphere (and hence also in surface
water at equilibrium with the atmosphere) was reconstructed based on the atmospheric time histories of these
gases (panel c; see also Körtzinger et al., 1999a, for the Excess CO 2 versus pCFC-11 time history). CFC-11 became
Preformed pCO (μatm)
Preformed TCO (μmol kg )
2
250
300
350
Depth (m)
0
1000
2000
3000
4000
5000
(d)
(e)
4
eq,t
pCO
from data
2
0
pCO
from CFC-11
2
eq,t
pCO
from CCl
2
CFC-11
undetectable
2
-1
2000
2050
2100
2150
2200
Air-Sea
Disequilib.
Preindustrial
Now
506
TCO 2 (μmol kg
–1 )
2100
2200
2300
Depth (m)
0
1000
2000
3000
4000
5000
pCO 2 (μatm)
250
300
350
0
100
200
300
0
1 0
1 5
Atmospheric Time Histories
0
100
200
300
pCO (μatm)
2
280
300
320
340
360
TCO
2
2
TCO 2
TCO 2
0
0
pCCl 4
(exp)
(exp)
pCFC-11
pCFC-11
pCCl 4
CCl 4
vs
CO 2
CFC-11
vs
CO 2
(a)
(c)
(b)
pCO
(meas)
(AOU-corr)
Equivalent Atmospheric Levels
pCCl 4 , pCFC-11 (x 10
–12 atm)
5
pCCl 4 , pCFC-11 (x 10
–12 atm)
(expanded scale)
pCCl 4 , pCFC-11 (x 10
-12 atm)
Fig. 6.3.7 Example of the application of the preformed-CO 2 method used by Holfort et al. (1998) to calculate
Excess TCO 2 concentrations. Example profiles from the western basin of the South Atlantic at 19°S are used to
illustrate the method. The procedure used was as follows:
1 Preformed values for TCO 2 (TCO 2
0 ) and pCO 2 (pCO 2
0
) were calculated as a function of depth (panel a), based on
the measured TCO 2 data and alkalinity data (not shown), after correcting these measured values for the effects of
oxygen utilization and carbonate dissolution. Panel (a) shows that the oxygen-based correction dominates the
correction of the TCO 2 data.
2 ‘Equivalent atmospheric concentrations’ for CFC-11 and CCl 4 samples (i.e. the partial pressures, pCFC-11 and pCCl 4 )
were calculated as a function of depth based on measured concentrations and the gas solubility at the potential
temperature and salinity of the samples (panel b). For clarity, the profiles are also shown on an expanded scale to
emphasize deep-water distributions. Detection limits for these compounds are of the order of 0.1 to 0.510
912 atm.
3 The temporal relationship between pCO 2 and pCFC-11 (and pCCl 4 ) in the atmosphere (and hence also in surface
water at equilibrium with the atmosphere) was reconstructed based on the atmospheric time histories of these
gases (panel c; see also Körtzinger et al., 1999a, for the Excess CO 2 versus pCFC-11 time history). CFC-11 became
Preformed pCO (μatm)
Preformed TCO (μmol kg )
2
250
300
350
Depth (m)
0
1000
2000
3000
4000
5000
(d)
(e)
4
eq,t
pCO
from data
2
0
pCO
from CFC-11
2
eq,t
pCO
from CCl
2
CFC-11
undetectable
2
-1
2000
2050
2100
2150
2200
Air-Sea
Disequilib.
Preindustrial
Now