

respect to ship-board analytical quality. Certified
Reference Materials (whose TCO 2 concentration
had been determined and Certified in the Keeling
laboratory by manometry) were analysed at sea,
during all cruises by coulometric titration. Replicates of a number of seawater samples that had
been analysed at sea were also shipped back to
the Keeling laboratory and analysed by manometry. In a perfect analytical world, any offsets
revealed between the coulometric determination
of the CRM concentration and its Certified
(manometry-determined) value would show up
as an identical offset between the at-sea coulometric and shore-based manometric measurements on the replicate seawater samples.
2 Links to historical ocean carbon data. Nearidentical sampling and analysis procedures had
been used by the Keeling laboratory on a subset
of samples collected during the GEOSECS,
SAVE and TTO programmes. The Keeling
shore-based measurements have suffered to a
lesser extent from the inevitable offsets associated with changes in measurement procedures
associated with the seagoing measurements.
Hence the collection of samples for shore-based
manometry provided an opportunity to link the
at-sea coulometric analyses made during WOCE,
with pre-WOCE at-sea measurements made
prior to the introduction of CRMs. Two potential disadvantages with the shore-based manometric analyses should be mentioned: (a) the
procedure is time-consuming which means that
only a limited number of samples could be analysed; (b) there is a risk of post-sampling concentration changes over the period (sometimes
months) between sample collection and analysis.
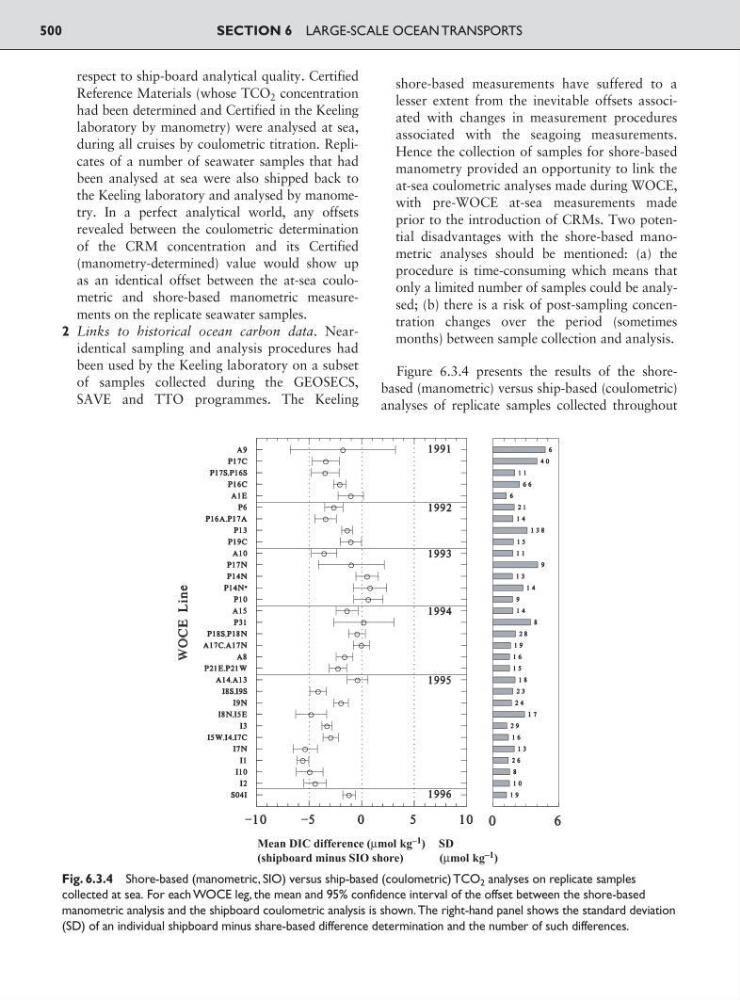
Figure 6.3.4 presents the results of the shorebased (manometric) versus ship-based (coulometric)
analyses of replicate samples collected throughout
SECTION 6 LARGE-SCALE OCEAN TRANSPORTS
500
Fig. 6.3.4 Shore-based (manometric, SIO) versus ship-based (coulometric) TCO 2 analyses on replicate samples
collected at sea. For each WOCE leg, the mean and 95% confidence interval of the offset between the shore-based
manometric analysis and the shipboard coulometric analysis is shown. The right-hand panel shows the standard deviation
(SD) of an individual shipboard minus share-based difference determination and the number of such differences.
Reference Materials (whose TCO 2 concentration
had been determined and Certified in the Keeling
laboratory by manometry) were analysed at sea,
during all cruises by coulometric titration. Replicates of a number of seawater samples that had
been analysed at sea were also shipped back to
the Keeling laboratory and analysed by manometry. In a perfect analytical world, any offsets
revealed between the coulometric determination
of the CRM concentration and its Certified
(manometry-determined) value would show up
as an identical offset between the at-sea coulometric and shore-based manometric measurements on the replicate seawater samples.
2 Links to historical ocean carbon data. Nearidentical sampling and analysis procedures had
been used by the Keeling laboratory on a subset
of samples collected during the GEOSECS,
SAVE and TTO programmes. The Keeling
shore-based measurements have suffered to a
lesser extent from the inevitable offsets associated with changes in measurement procedures
associated with the seagoing measurements.
Hence the collection of samples for shore-based
manometry provided an opportunity to link the
at-sea coulometric analyses made during WOCE,
with pre-WOCE at-sea measurements made
prior to the introduction of CRMs. Two potential disadvantages with the shore-based manometric analyses should be mentioned: (a) the
procedure is time-consuming which means that
only a limited number of samples could be analysed; (b) there is a risk of post-sampling concentration changes over the period (sometimes
months) between sample collection and analysis.
Figure 6.3.4 presents the results of the shorebased (manometric) versus ship-based (coulometric)
analyses of replicate samples collected throughout
SECTION 6 LARGE-SCALE OCEAN TRANSPORTS
500
Fig. 6.3.4 Shore-based (manometric, SIO) versus ship-based (coulometric) TCO 2 analyses on replicate samples
collected at sea. For each WOCE leg, the mean and 95% confidence interval of the offset between the shore-based
manometric analysis and the shipboard coulometric analysis is shown. The right-hand panel shows the standard deviation
(SD) of an individual shipboard minus share-based difference determination and the number of such differences.