

the Baumgartner and Reichel (1975) climatology,
Wijffels et al. (1992) deduced that the Pacific
received an excess of roughly 0.5 Sv of fresh water,
which was then redistributed by the interocean
circulation to the evaporative basins of the
Atlantic and Indian Oceans via exchange through
the Indonesian Throughflow, Bering Strait and
Southern Ocean. However, the new direct ocean
estimates indicate a different scenario.
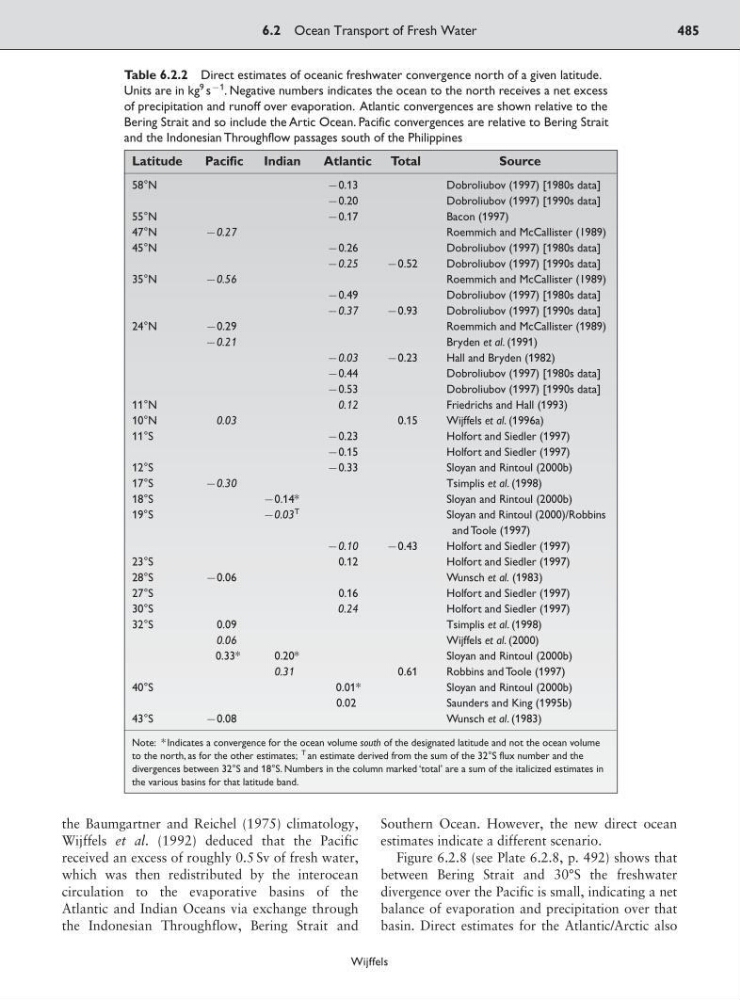
Figure 6.2.8 (see Plate 6.2.8, p. 492) shows that
between Bering Strait and 30°S the freshwater
divergence over the Pacific is small, indicating a net
balance of evaporation and precipitation over that
basin. Direct estimates for the Atlantic/Arctic also
6.2 Ocean Transport of Fresh Water
485
Wijffels
Table 6.2.2 Direct estimates of oceanic freshwater convergence north of a given latitude.
Units are in kg
9 s
91 . Negative numbers indicates the ocean to the north receives a net excess
of precipitation and runoff over evaporation. Atlantic convergences are shown relative to the
Bering Strait and so include the Artic Ocean. Pacific convergences are relative to Bering Strait
and the Indonesian Throughflow passages south of the Philippines
Latitude
Pacific
Indian
Atlantic Total
Source
58°N
90.13
Dobroliubov (1997) [1980s data]
90.20
Dobroliubov (1997) [1990s data]
55°N
90.17
Bacon (1997)
47°N
90.27
Roemmich and McCallister (1989)
45°N
90.26
Dobroliubov (1997) [1980s data]
90.25
90.52
Dobroliubov (1997) [1990s data]
35°N
90.56
Roemmich and McCallister (1989)
90.49
Dobroliubov (1997) [1980s data]
90.37
90.93
Dobroliubov (1997) [1990s data]
24°N
90.29
Roemmich and McCallister (1989)
90.21
Bryden et al. (1991)
90.03
90.23
Hall and Bryden (1982)
90.44
Dobroliubov (1997) [1980s data]
90.53
Dobroliubov (1997) [1990s data]
11°N
0.12
Friedrichs and Hall (1993)
10°N
0.03
0.15
Wijffels et al. (1996a)
11°S
90.23
Holfort and Siedler (1997)
90.15
Holfort and Siedler (1997)
12°S
90.33
Sloyan and Rintoul (2000b)
17°S
90.30
Tsimplis et al. (1998)
18°S
90.14*
Sloyan and Rintoul (2000b)
19°S
90.03
T
Sloyan and Rintoul (2000)/Robbins
and Toole (1997)
90.10
90.43
Holfort and Siedler (1997)
23°S
0.12
Holfort and Siedler (1997)
28°S
90.06
Wunsch et al. (1983)
27°S
0.16
Holfort and Siedler (1997)
30°S
0.24
Holfort and Siedler (1997)
32°S
0.09
Tsimplis et al. (1998)
0.06
Wijffels et al. (2000)
0.33*
0.20*
Sloyan and Rintoul (2000b)
0.31
0.61
Robbins and Toole (1997)
40°S
0.01*
Sloyan and Rintoul (2000b)
0.02
Saunders and King (1995b)
43°S
90.08
Wunsch et al. (1983)
Note: * Indicates a convergence for the ocean volume south of the designated latitude and not the ocean volume
to the north, as for the other estimates;
T an estimate derived from the sum of the 32°S flux number and the
divergences between 32°S and 18°S. Numbers in the column marked ‘total’ are a sum of the italicized estimates in
the various basins for that latitude band.
Wijffels et al. (1992) deduced that the Pacific
received an excess of roughly 0.5 Sv of fresh water,
which was then redistributed by the interocean
circulation to the evaporative basins of the
Atlantic and Indian Oceans via exchange through
the Indonesian Throughflow, Bering Strait and
Southern Ocean. However, the new direct ocean
estimates indicate a different scenario.
Figure 6.2.8 (see Plate 6.2.8, p. 492) shows that
between Bering Strait and 30°S the freshwater
divergence over the Pacific is small, indicating a net
balance of evaporation and precipitation over that
basin. Direct estimates for the Atlantic/Arctic also
6.2 Ocean Transport of Fresh Water
485
Wijffels
Table 6.2.2 Direct estimates of oceanic freshwater convergence north of a given latitude.
Units are in kg
9 s
91 . Negative numbers indicates the ocean to the north receives a net excess
of precipitation and runoff over evaporation. Atlantic convergences are shown relative to the
Bering Strait and so include the Artic Ocean. Pacific convergences are relative to Bering Strait
and the Indonesian Throughflow passages south of the Philippines
Latitude
Pacific
Indian
Atlantic Total
Source
58°N
90.13
Dobroliubov (1997) [1980s data]
90.20
Dobroliubov (1997) [1990s data]
55°N
90.17
Bacon (1997)
47°N
90.27
Roemmich and McCallister (1989)
45°N
90.26
Dobroliubov (1997) [1980s data]
90.25
90.52
Dobroliubov (1997) [1990s data]
35°N
90.56
Roemmich and McCallister (1989)
90.49
Dobroliubov (1997) [1980s data]
90.37
90.93
Dobroliubov (1997) [1990s data]
24°N
90.29
Roemmich and McCallister (1989)
90.21
Bryden et al. (1991)
90.03
90.23
Hall and Bryden (1982)
90.44
Dobroliubov (1997) [1980s data]
90.53
Dobroliubov (1997) [1990s data]
11°N
0.12
Friedrichs and Hall (1993)
10°N
0.03
0.15
Wijffels et al. (1996a)
11°S
90.23
Holfort and Siedler (1997)
90.15
Holfort and Siedler (1997)
12°S
90.33
Sloyan and Rintoul (2000b)
17°S
90.30
Tsimplis et al. (1998)
18°S
90.14*
Sloyan and Rintoul (2000b)
19°S
90.03
T
Sloyan and Rintoul (2000)/Robbins
and Toole (1997)
90.10
90.43
Holfort and Siedler (1997)
23°S
0.12
Holfort and Siedler (1997)
28°S
90.06
Wunsch et al. (1983)
27°S
0.16
Holfort and Siedler (1997)
30°S
0.24
Holfort and Siedler (1997)
32°S
0.09
Tsimplis et al. (1998)
0.06
Wijffels et al. (2000)
0.33*
0.20*
Sloyan and Rintoul (2000b)
0.31
0.61
Robbins and Toole (1997)
40°S
0.01*
Sloyan and Rintoul (2000b)
0.02
Saunders and King (1995b)
43°S
90.08
Wunsch et al. (1983)
Note: * Indicates a convergence for the ocean volume south of the designated latitude and not the ocean volume
to the north, as for the other estimates;
T an estimate derived from the sum of the 32°S flux number and the
divergences between 32°S and 18°S. Numbers in the column marked ‘total’ are a sum of the italicized estimates in
the various basins for that latitude band.