

be tested if we want to obtain confidence in their
predictive capabilities. Comparisons of model and
observed tracer inventories derived from the
WOCE programme will provide an important test
of these models.
Acknowledgements
The collection of the WOCE tracer data reported
in this contribution was primarily supported by
numerous grants by the National Science Foundation (RF: OCE92-07237, OCE94-13222, OCE9529847, OCE98-11535; WJ: OCE-9207162,
OCE-9313928, OCE-9633276; JL: OCE91-05884,
OCE-92-96237, OCE92-96169, OCE97-30431,
OCE98-20132; RK: OCE-9986310, OCE-9617972;
PS: OCE 91-11404; WMS: OCE 95-37864; OCE
98-11034) and the National Oceanographic and
Atmospheric Administration (JB: OGP and OACES;
RF: NA37RJ0200; JL: VENTS Program; PS:
NA16RC0512, NA46GP0112, NA86GP0375,
CORC). Support was also provided by the BMBF,
5.8 Transformation and Age of Water Masses
451
Schlosser et al.
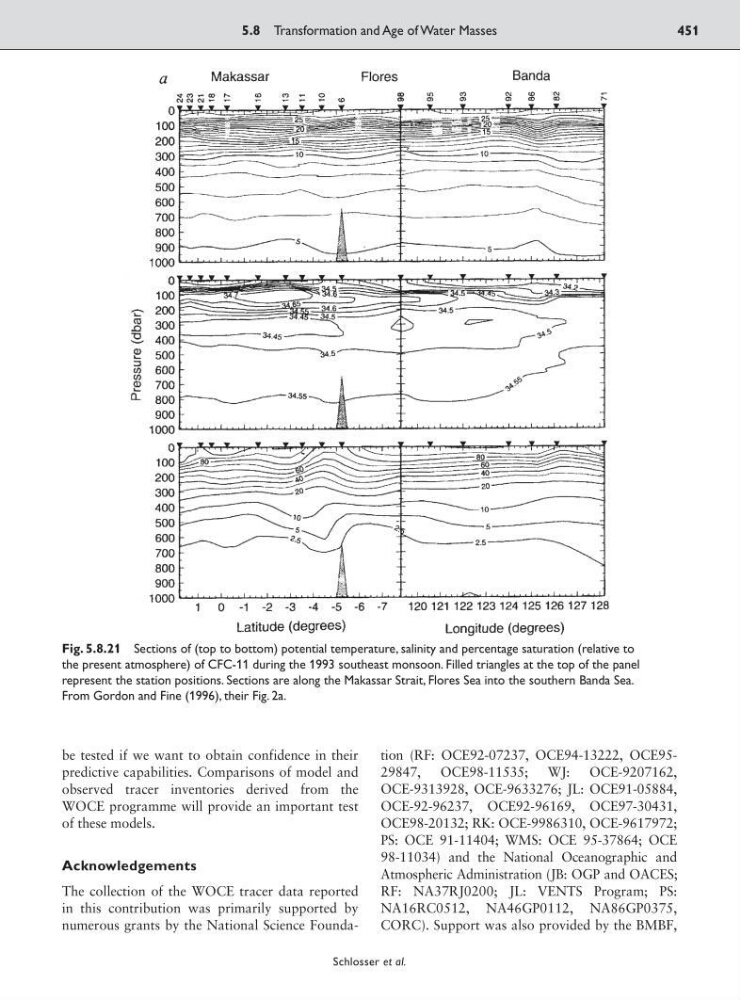
Fig. 5.8.21 Sections of (top to bottom) potential temperature, salinity and percentage saturation (relative to
the present atmosphere) of CFC-11 during the 1993 southeast monsoon. Filled triangles at the top of the panel
represent the station positions. Sections are along the Makassar Strait, Flores Sea into the southern Banda Sea.
From Gordon and Fine (1996), their Fig. 2a.
predictive capabilities. Comparisons of model and
observed tracer inventories derived from the
WOCE programme will provide an important test
of these models.
Acknowledgements
The collection of the WOCE tracer data reported
in this contribution was primarily supported by
numerous grants by the National Science Foundation (RF: OCE92-07237, OCE94-13222, OCE9529847, OCE98-11535; WJ: OCE-9207162,
OCE-9313928, OCE-9633276; JL: OCE91-05884,
OCE-92-96237, OCE92-96169, OCE97-30431,
OCE98-20132; RK: OCE-9986310, OCE-9617972;
PS: OCE 91-11404; WMS: OCE 95-37864; OCE
98-11034) and the National Oceanographic and
Atmospheric Administration (JB: OGP and OACES;
RF: NA37RJ0200; JL: VENTS Program; PS:
NA16RC0512, NA46GP0112, NA86GP0375,
CORC). Support was also provided by the BMBF,
5.8 Transformation and Age of Water Masses
451
Schlosser et al.
Fig. 5.8.21 Sections of (top to bottom) potential temperature, salinity and percentage saturation (relative to
the present atmosphere) of CFC-11 during the 1993 southeast monsoon. Filled triangles at the top of the panel
represent the station positions. Sections are along the Makassar Strait, Flores Sea into the southern Banda Sea.
From Gordon and Fine (1996), their Fig. 2a.