

Water. The flow hugs the flank of the Tonga–
Kermadec Ridge at this latitude as a deep western
boundary current. Recently, Whitworth et al.
(1999) described the flow and transport in this
region based on a 2-year current meter array
(WOCE PCM9) deployment. They found that the
boundary current was 550 km wide and had a
maximum mean velocity of 9.6 cm s
91
. They estimated a mean net northward transport from
2000 m to the bottom of (16.0 <11.9)10
6 m
3 s
91
.
Of this, approximately (15.8 <9.2)10
6 m
3 s
91
was northward-flowing Circumpolar Deep Water
and (0.2 < 5.1)10
6 m
3 s
91 was northward-flowing Pacific Deep Water.
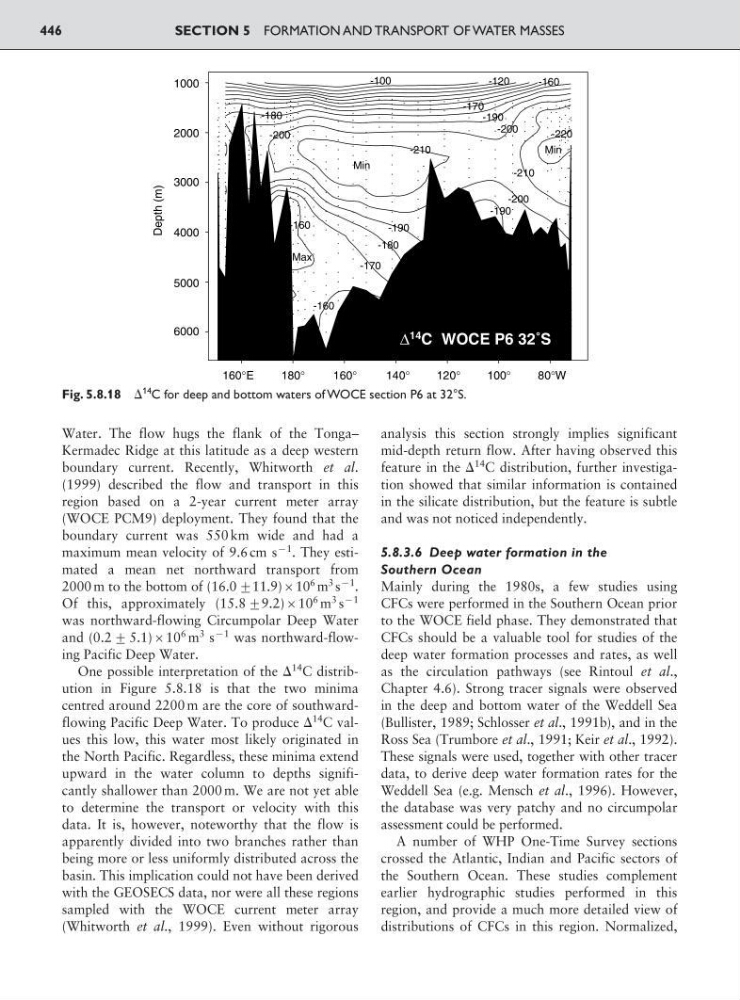
One possible interpretation of the ⌬
14 C distribution in Figure 5.8.18 is that the two minima
centred around 2200 m are the core of southwardflowing Pacific Deep Water. To produce ⌬
14 C values this low, this water most likely originated in
the North Pacific. Regardless, these minima extend
upward in the water column to depths significantly shallower than 2000 m. We are not yet able
to determine the transport or velocity with this
data. It is, however, noteworthy that the flow is
apparently divided into two branches rather than
being more or less uniformly distributed across the
basin. This implication could not have been derived
with the GEOSECS data, nor were all these regions
sampled with the WOCE current meter array
(Whitworth et al., 1999). Even without rigorous
analysis this section strongly implies significant
mid-depth return flow. After having observed this
feature in the ⌬
14 C distribution, further investigation showed that similar information is contained
in the silicate distribution, but the feature is subtle
and was not noticed independently.
5.8.3.6 Deep water formation in the
Southern Ocean
Mainly during the 1980s, a few studies using
CFCs were performed in the Southern Ocean prior
to the WOCE field phase. They demonstrated that
CFCs should be a valuable tool for studies of the
deep water formation processes and rates, as well
as the circulation pathways (see Rintoul et al.,
Chapter 4.6). Strong tracer signals were observed
in the deep and bottom water of the Weddell Sea
(Bullister, 1989; Schlosser et al., 1991b), and in the
Ross Sea (Trumbore et al., 1991; Keir et al., 1992).
These signals were used, together with other tracer
data, to derive deep water formation rates for the
Weddell Sea (e.g. Mensch et al., 1996). However,
the database was very patchy and no circumpolar
assessment could be performed.
A number of WHP One-Time Survey sections
crossed the Atlantic, Indian and Pacific sectors of
the Southern Ocean. These studies complement
earlier hydrographic studies performed in this
region, and provide a much more detailed view of
distributions of CFCs in this region. Normalized,
SECTION 5 FORMATION AND TRANSPORT OF WATER MASSES
446
.
.
.
.
.
.
.
.
.
.
.
.
.
.
.
.
.
.
.
.
.
.
.
.
.
.
.
.
.
.
.
.
.
.
.
.
.
.
.
.
.
.
.
.
.
.
.
.
.
.
.
.
.
.
.
.
.
.
.
.
.
.
.
.
.
.
.
.
.
.
.
.
.
.
.
.
.
.
.
.
.
.
.
.
.
.
.
.
.
. .
.
.
.
.
.
.
.
.
.
.
.
.
.
.
.
.
.
.
.
.
.
.
.
.
.
.
.
.
.
.
.
.
.
.
.
.
.
.
.
.
.
.
.
.
.
.
.
.
.
.
.
.
.
.
.
.
.
.
.
.
.
.
.
.
.
.
.
.
.
.
.
.
.
.
.
.
.
.
.
.
.
.
.
.
.
.
.
.
.
.
.
.
.
.
.
.
.
.
.
.
.
.
.
.
.
.
.
.
.
.
.
.
.
.
.
.
.
.
.
.
.
.
.
.
.
.
.
.
.
.
.
.
.
.
.
.
.
.
.
.
.
.
.
.
.
.
.
.
.
.
.
.
.
.
.
.
.
.
.
.
.
.
.
.
.
.
.
.
.
.
.
.
.
.
.
.
.
.
.
.
.
.
.
.
.
.
.
.
.
.
.
.
.
.
.
.
.
.
.
.
.
.
.
.
.
.
.
.
.
.
.
.
.
. .
.
.
.
.
.
.
.
.
.
.
.
. .
. . . .
.
.
.
.
.
.
.
.
.
.
.
.
. .
. .
.
.
.
.
.
.
.
.
.
.
.
.
.
.
.
.
.
.
.
.
.
.
.
.
.
.
.
.
.
.
.
.
.
.
.
.
.
.
.
.
.
.
.
.
.
.
.
.
.
.
.
.
.
.
.
.
.
.
.
.
.
.
.
.
.
.
.
.
.
. .
.
.
.
.
.
.
.
.
.
.
.
.
.
.
.
.
.
.
.
.
.
.
.
.
.
.
.
.
.
.
.
.
.
.
.
.
.
.
.
.
.
.
.
.
.
.
.
.
.
.
.
.
.
.
.
.
.
.
.
.
.
.
.
Min
Min
Max
-160
-160
-160
-220
-210
-210
-200
-200
-200
-190
-190
-190
-180
-180
-170
-170
-100
-120
1000
2000
3000
4000
5000
6000
160°E
180°
160°
140°
120°
100°
80°W
Depth (m)
Δ
14 C WOCE P6 32˚S
Fig. 5.8.18 ⌬
14 C for deep and bottom waters of WOCE section P6 at 32°S.
Kermadec Ridge at this latitude as a deep western
boundary current. Recently, Whitworth et al.
(1999) described the flow and transport in this
region based on a 2-year current meter array
(WOCE PCM9) deployment. They found that the
boundary current was 550 km wide and had a
maximum mean velocity of 9.6 cm s
91
. They estimated a mean net northward transport from
2000 m to the bottom of (16.0 <11.9)10
6 m
3 s
91
.
Of this, approximately (15.8 <9.2)10
6 m
3 s
91
was northward-flowing Circumpolar Deep Water
and (0.2 < 5.1)10
6 m
3 s
91 was northward-flowing Pacific Deep Water.
One possible interpretation of the ⌬
14 C distribution in Figure 5.8.18 is that the two minima
centred around 2200 m are the core of southwardflowing Pacific Deep Water. To produce ⌬
14 C values this low, this water most likely originated in
the North Pacific. Regardless, these minima extend
upward in the water column to depths significantly shallower than 2000 m. We are not yet able
to determine the transport or velocity with this
data. It is, however, noteworthy that the flow is
apparently divided into two branches rather than
being more or less uniformly distributed across the
basin. This implication could not have been derived
with the GEOSECS data, nor were all these regions
sampled with the WOCE current meter array
(Whitworth et al., 1999). Even without rigorous
analysis this section strongly implies significant
mid-depth return flow. After having observed this
feature in the ⌬
14 C distribution, further investigation showed that similar information is contained
in the silicate distribution, but the feature is subtle
and was not noticed independently.
5.8.3.6 Deep water formation in the
Southern Ocean
Mainly during the 1980s, a few studies using
CFCs were performed in the Southern Ocean prior
to the WOCE field phase. They demonstrated that
CFCs should be a valuable tool for studies of the
deep water formation processes and rates, as well
as the circulation pathways (see Rintoul et al.,
Chapter 4.6). Strong tracer signals were observed
in the deep and bottom water of the Weddell Sea
(Bullister, 1989; Schlosser et al., 1991b), and in the
Ross Sea (Trumbore et al., 1991; Keir et al., 1992).
These signals were used, together with other tracer
data, to derive deep water formation rates for the
Weddell Sea (e.g. Mensch et al., 1996). However,
the database was very patchy and no circumpolar
assessment could be performed.
A number of WHP One-Time Survey sections
crossed the Atlantic, Indian and Pacific sectors of
the Southern Ocean. These studies complement
earlier hydrographic studies performed in this
region, and provide a much more detailed view of
distributions of CFCs in this region. Normalized,
SECTION 5 FORMATION AND TRANSPORT OF WATER MASSES
446
.
.
.
.
.
.
.
.
.
.
.
.
.
.
.
.
.
.
.
.
.
.
.
.
.
.
.
.
.
.
.
.
.
.
.
.
.
.
.
.
.
.
.
.
.
.
.
.
.
.
.
.
.
.
.
.
.
.
.
.
.
.
.
.
.
.
.
.
.
.
.
.
.
.
.
.
.
.
.
.
.
.
.
.
.
.
.
.
.
. .
.
.
.
.
.
.
.
.
.
.
.
.
.
.
.
.
.
.
.
.
.
.
.
.
.
.
.
.
.
.
.
.
.
.
.
.
.
.
.
.
.
.
.
.
.
.
.
.
.
.
.
.
.
.
.
.
.
.
.
.
.
.
.
.
.
.
.
.
.
.
.
.
.
.
.
.
.
.
.
.
.
.
.
.
.
.
.
.
.
.
.
.
.
.
.
.
.
.
.
.
.
.
.
.
.
.
.
.
.
.
.
.
.
.
.
.
.
.
.
.
.
.
.
.
.
.
.
.
.
.
.
.
.
.
.
.
.
.
.
.
.
.
.
.
.
.
.
.
.
.
.
.
.
.
.
.
.
.
.
.
.
.
.
.
.
.
.
.
.
.
.
.
.
.
.
.
.
.
.
.
.
.
.
.
.
.
.
.
.
.
.
.
.
.
.
.
.
.
.
.
.
.
.
.
.
.
.
.
.
.
.
.
.
. .
.
.
.
.
.
.
.
.
.
.
.
. .
. . . .
.
.
.
.
.
.
.
.
.
.
.
.
. .
. .
.
.
.
.
.
.
.
.
.
.
.
.
.
.
.
.
.
.
.
.
.
.
.
.
.
.
.
.
.
.
.
.
.
.
.
.
.
.
.
.
.
.
.
.
.
.
.
.
.
.
.
.
.
.
.
.
.
.
.
.
.
.
.
.
.
.
.
.
.
. .
.
.
.
.
.
.
.
.
.
.
.
.
.
.
.
.
.
.
.
.
.
.
.
.
.
.
.
.
.
.
.
.
.
.
.
.
.
.
.
.
.
.
.
.
.
.
.
.
.
.
.
.
.
.
.
.
.
.
.
.
.
.
.
Min
Min
Max
-160
-160
-160
-220
-210
-210
-200
-200
-200
-190
-190
-190
-180
-180
-170
-170
-100
-120
1000
2000
3000
4000
5000
6000
160°E
180°
160°
140°
120°
100°
80°W
Depth (m)
Δ
14 C WOCE P6 32˚S
Fig. 5.8.18 ⌬
14 C for deep and bottom waters of WOCE section P6 at 32°S.