

was occupied in 1994 (Messias and Memery,
1998). Comparison of these data with the SAVE
data show a sharp increase in the CFC concentration in AABW in the Brazil Basin, which was just
above background during SAVE. CFCs were
detected in AABW all the way to the equator just
south of the Mid-Ocean Ridge (Rhein et al.,
1998b). The prominent upper NADW and lower
NADW CFC maxima observed in the North
Atlantic, but barely detectable during SAVE, were
observed at 24°S, 20°S and 10°S, indicating eastward zonal flow of NADW away from the DWBC.
Several cruises were completed in the equatorial
Atlantic as part of the WOCE Deep Basin Experiment and repeat hydrography programmes between
1991 and 1996. The CFC concentrations in the
deep water increased as expected during this time,
but the increase was not as smooth as would be
expected from the source functions, indicating
variability in mixing and transports (Rhein et al.,
1998a; Andrié et al., 1999). These cruises confirmed that both the upper and lower CFC maxima
split near the equator with one branch extending in
the DWBC across the equator and the other spreading along the equator (Andrié et al., 1998; Messias
et al., 1999). There is some recirculation of the
lower CFC maximum in the Guyana Basin. The
WOCE observations suggest that this recirculation
does not extend to the Mid-Atlantic Ridge and has
a strength of Ϸ3 <1.5 Sv (Plähn and Rhein, 1998).
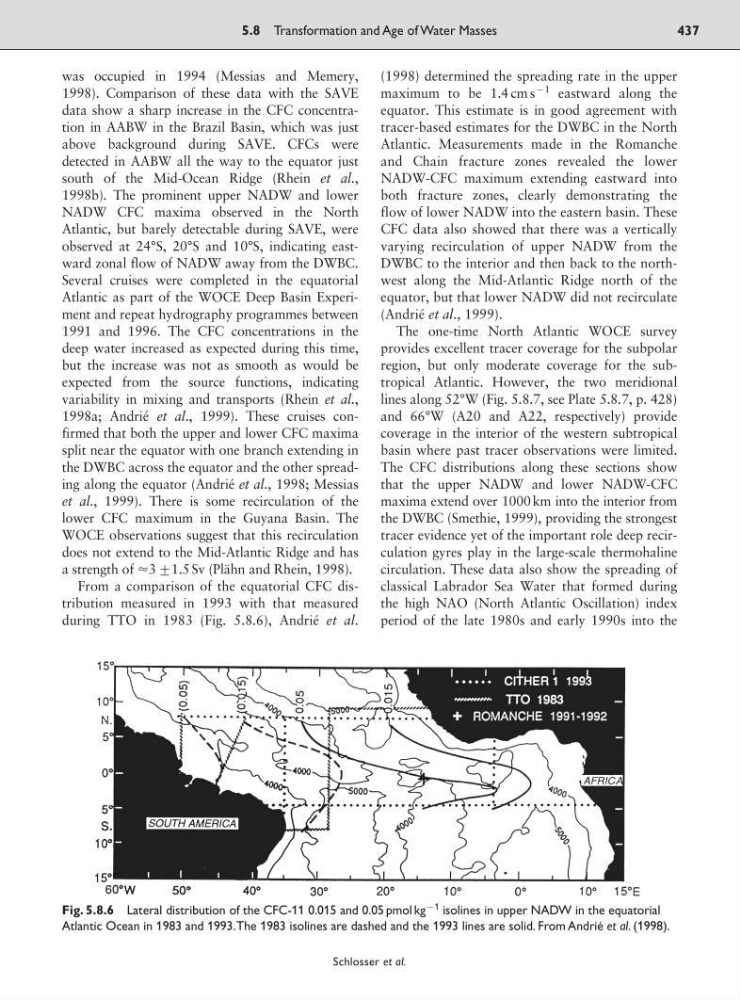
From a comparison of the equatorial CFC distribution measured in 1993 with that measured
during TTO in 1983 (Fig. 5.8.6), Andrié et al.
(1998) determined the spreading rate in the upper
maximum to be 1.4 cm s
91 eastward along the
equator. This estimate is in good agreement with
tracer-based estimates for the DWBC in the North
Atlantic. Measurements made in the Romanche
and Chain fracture zones revealed the lower
NADW-CFC maximum extending eastward into
both fracture zones, clearly demonstrating the
flow of lower NADW into the eastern basin. These
CFC data also showed that there was a vertically
varying recirculation of upper NADW from the
DWBC to the interior and then back to the northwest along the Mid-Atlantic Ridge north of the
equator, but that lower NADW did not recirculate
(Andrié et al., 1999).
The one-time North Atlantic WOCE survey
provides excellent tracer coverage for the subpolar
region, but only moderate coverage for the subtropical Atlantic. However, the two meridional
lines along 52°W (Fig. 5.8.7, see Plate 5.8.7, p. 428)
and 66°W (A20 and A22, respectively) provide
coverage in the interior of the western subtropical
basin where past tracer observations were limited.
The CFC distributions along these sections show
that the upper NADW and lower NADW-CFC
maxima extend over 1000 km into the interior from
the DWBC (Smethie, 1999), providing the strongest
tracer evidence yet of the important role deep recirculation gyres play in the large-scale thermohaline
circulation. These data also show the spreading of
classical Labrador Sea Water that formed during
the high NAO (North Atlantic Oscillation) index
period of the late 1980s and early 1990s into the
5.8 Transformation and Age of Water Masses
437
Schlosser et al.
Fig. 5.8.6 Lateral distribution of the CFC-11 0.015 and 0.05 pmol kg
91 isolines in upper NADW in the equatorial
Atlantic Ocean in 1983 and 1993.The 1983 isolines are dashed and the 1993 lines are solid. From Andrié et al. (1998).
1998). Comparison of these data with the SAVE
data show a sharp increase in the CFC concentration in AABW in the Brazil Basin, which was just
above background during SAVE. CFCs were
detected in AABW all the way to the equator just
south of the Mid-Ocean Ridge (Rhein et al.,
1998b). The prominent upper NADW and lower
NADW CFC maxima observed in the North
Atlantic, but barely detectable during SAVE, were
observed at 24°S, 20°S and 10°S, indicating eastward zonal flow of NADW away from the DWBC.
Several cruises were completed in the equatorial
Atlantic as part of the WOCE Deep Basin Experiment and repeat hydrography programmes between
1991 and 1996. The CFC concentrations in the
deep water increased as expected during this time,
but the increase was not as smooth as would be
expected from the source functions, indicating
variability in mixing and transports (Rhein et al.,
1998a; Andrié et al., 1999). These cruises confirmed that both the upper and lower CFC maxima
split near the equator with one branch extending in
the DWBC across the equator and the other spreading along the equator (Andrié et al., 1998; Messias
et al., 1999). There is some recirculation of the
lower CFC maximum in the Guyana Basin. The
WOCE observations suggest that this recirculation
does not extend to the Mid-Atlantic Ridge and has
a strength of Ϸ3 <1.5 Sv (Plähn and Rhein, 1998).
From a comparison of the equatorial CFC distribution measured in 1993 with that measured
during TTO in 1983 (Fig. 5.8.6), Andrié et al.
(1998) determined the spreading rate in the upper
maximum to be 1.4 cm s
91 eastward along the
equator. This estimate is in good agreement with
tracer-based estimates for the DWBC in the North
Atlantic. Measurements made in the Romanche
and Chain fracture zones revealed the lower
NADW-CFC maximum extending eastward into
both fracture zones, clearly demonstrating the
flow of lower NADW into the eastern basin. These
CFC data also showed that there was a vertically
varying recirculation of upper NADW from the
DWBC to the interior and then back to the northwest along the Mid-Atlantic Ridge north of the
equator, but that lower NADW did not recirculate
(Andrié et al., 1999).
The one-time North Atlantic WOCE survey
provides excellent tracer coverage for the subpolar
region, but only moderate coverage for the subtropical Atlantic. However, the two meridional
lines along 52°W (Fig. 5.8.7, see Plate 5.8.7, p. 428)
and 66°W (A20 and A22, respectively) provide
coverage in the interior of the western subtropical
basin where past tracer observations were limited.
The CFC distributions along these sections show
that the upper NADW and lower NADW-CFC
maxima extend over 1000 km into the interior from
the DWBC (Smethie, 1999), providing the strongest
tracer evidence yet of the important role deep recirculation gyres play in the large-scale thermohaline
circulation. These data also show the spreading of
classical Labrador Sea Water that formed during
the high NAO (North Atlantic Oscillation) index
period of the late 1980s and early 1990s into the
5.8 Transformation and Age of Water Masses
437
Schlosser et al.
Fig. 5.8.6 Lateral distribution of the CFC-11 0.015 and 0.05 pmol kg
91 isolines in upper NADW in the equatorial
Atlantic Ocean in 1983 and 1993.The 1983 isolines are dashed and the 1993 lines are solid. From Andrié et al. (1998).