

(Gerdes et al., 1999) suggest that a correct representation of the Mediterranean salt tongue in the
North Atlantic requires correct inclusion of the
outflow mass volume rather than the frequently
used procedure of only specifying a salinity source
at the location of the Strait of Gibraltar. The
transport estimates shown here, which are close to
1 Sv each way, are significantly higher, about
30%, than those calculated from earlier data
(Bryden et al., 1994). This increase principally
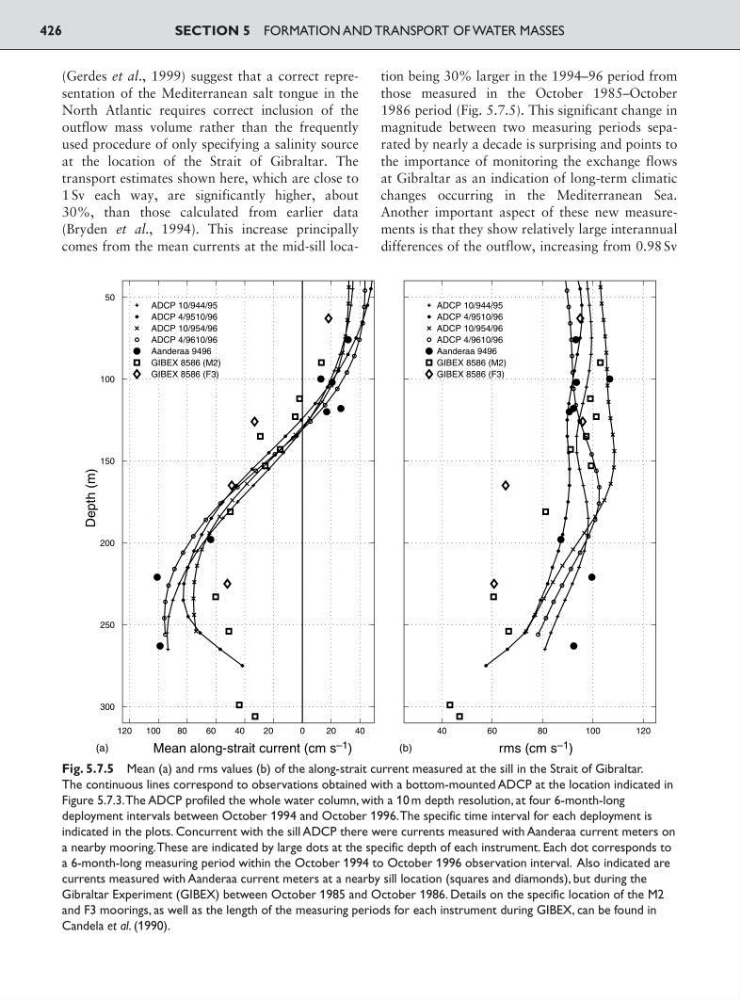
comes from the mean currents at the mid-sill location being 30% larger in the 1994–96 period from
those measured in the October 1985–October
1986 period (Fig. 5.7.5). This significant change in
magnitude between two measuring periods separated by nearly a decade is surprising and points to
the importance of monitoring the exchange flows
at Gibraltar as an indication of long-term climatic
changes occurring in the Mediterranean Sea.
Another important aspect of these new measurements is that they show relatively large interannual
differences of the outflow, increasing from 0.98 Sv
SECTION 5 FORMATION AND TRANSPORT OF WATER MASSES
426
120
(a)
(b)
100
80
60
40
20
0
20
40
300
250
200
150
100
50
Mean along-strait current (cm s –1 )
Depth (m)
ADCP 10/944/95
ADCP 4/9510/96
ADCP 10/954/96
ADCP 4/9610/96
GIBEX 8586 (M2)
GIBEX 8586 (F3)
Aanderaa 9496
40
60
80
100
120
ADCP 10/944/95
ADCP 4/9510/96
ADCP 10/954/96
ADCP 4/9610/96
GIBEX 8586 (M2)
GIBEX 8586 (F3)
Aanderaa 9496
rms (cm s –1 )
Fig. 5.7.5 Mean (a) and rms values (b) of the along-strait current measured at the sill in the Strait of Gibraltar.
The continuous lines correspond to observations obtained with a bottom-mounted ADCP at the location indicated in
Figure 5.7.3.The ADCP profiled the whole water column, with a 10 m depth resolution, at four 6-month-long
deployment intervals between October 1994 and October 1996.The specific time interval for each deployment is
indicated in the plots. Concurrent with the sill ADCP there were currents measured with Aanderaa current meters on
a nearby mooring.These are indicated by large dots at the specific depth of each instrument. Each dot corresponds to
a 6-month-long measuring period within the October 1994 to October 1996 observation interval. Also indicated are
currents measured with Aanderaa current meters at a nearby sill location (squares and diamonds), but during the
Gibraltar Experiment (GIBEX) between October 1985 and October 1986. Details on the specific location of the M2
and F3 moorings, as well as the length of the measuring periods for each instrument during GIBEX, can be found in
Candela et al. (1990).
North Atlantic requires correct inclusion of the
outflow mass volume rather than the frequently
used procedure of only specifying a salinity source
at the location of the Strait of Gibraltar. The
transport estimates shown here, which are close to
1 Sv each way, are significantly higher, about
30%, than those calculated from earlier data
(Bryden et al., 1994). This increase principally
comes from the mean currents at the mid-sill location being 30% larger in the 1994–96 period from
those measured in the October 1985–October
1986 period (Fig. 5.7.5). This significant change in
magnitude between two measuring periods separated by nearly a decade is surprising and points to
the importance of monitoring the exchange flows
at Gibraltar as an indication of long-term climatic
changes occurring in the Mediterranean Sea.
Another important aspect of these new measurements is that they show relatively large interannual
differences of the outflow, increasing from 0.98 Sv
SECTION 5 FORMATION AND TRANSPORT OF WATER MASSES
426
120
(a)
(b)
100
80
60
40
20
0
20
40
300
250
200
150
100
50
Mean along-strait current (cm s –1 )
Depth (m)
ADCP 10/944/95
ADCP 4/9510/96
ADCP 10/954/96
ADCP 4/9610/96
GIBEX 8586 (M2)
GIBEX 8586 (F3)
Aanderaa 9496
40
60
80
100
120
ADCP 10/944/95
ADCP 4/9510/96
ADCP 10/954/96
ADCP 4/9610/96
GIBEX 8586 (M2)
GIBEX 8586 (F3)
Aanderaa 9496
rms (cm s –1 )
Fig. 5.7.5 Mean (a) and rms values (b) of the along-strait current measured at the sill in the Strait of Gibraltar.
The continuous lines correspond to observations obtained with a bottom-mounted ADCP at the location indicated in
Figure 5.7.3.The ADCP profiled the whole water column, with a 10 m depth resolution, at four 6-month-long
deployment intervals between October 1994 and October 1996.The specific time interval for each deployment is
indicated in the plots. Concurrent with the sill ADCP there were currents measured with Aanderaa current meters on
a nearby mooring.These are indicated by large dots at the specific depth of each instrument. Each dot corresponds to
a 6-month-long measuring period within the October 1994 to October 1996 observation interval. Also indicated are
currents measured with Aanderaa current meters at a nearby sill location (squares and diamonds), but during the
Gibraltar Experiment (GIBEX) between October 1985 and October 1986. Details on the specific location of the M2
and F3 moorings, as well as the length of the measuring periods for each instrument during GIBEX, can be found in
Candela et al. (1990).