

4.6 The Antarctic Circumpolar Current System
275
Rintoul, Hughes and Olbers
0
500
1000
1500
2000
2500
0
500
1000
1500
2000
2500
3000
3500
4000
4500
5000
DISTANCE (km)
PRESSURE (dbar)
1 .5
0 . 4
0
.
2
0
0
0 .2
0 .2
0 .4
0 .4
0.4
0 . 6
0 .6
0.6
0 . 8
0 . 8
0.8
1
1
1
1 . 2
1.2
1.2
1.2
1 .4
1.4
1.4
1.4
1. 6
1. 6
1 .6
1.6
1 . 8
1 . 8
1.8
1.8
2
2
2
2 .2
2. 2
2 .2
2 .4
2 .6
3
5
6
45
46
47
48
49
50
51
52
53
54
55
56
57
58
59
60
61
62
63
64
65
l
l
l
l
l
l
l
l
l
l
l
l
l
l
l
l
l
l
l
l
l
LATITUDE (°S)
l lll l l l
l l l l l l l l l l l l l l l l l l l l l l l l l l l l l l l l l l l l l l l l l l l l l l l lll
Θ
SAMW
STF
SAF
SAF
PF
PF
SF
SB
ASF
a
0
500
1000
1500
2000
2500
0
500
1000
1500
2000
2500
3000
3500
4000
4500
5000
DISTANCE (km)
PRESSURE (dbar)
3 4 .2
34. 3
3 4 . 4
34.5
3
4
.
6
3 4 . 6
34.7
34. 7
3 4 . 7 2
34.7 4
3
4
.
6
8
45
46
47
48
49
50
51
52
53
54
55
56
57
58
59
60
61
62
63
64
65
l
l
l
l
l
l
l
l
l
l
l
l
l
l
l
l
l
l
l
l
l
LATITUDE (°S)
l lll l l l
l l l l l l l l l l l l l l l l l l l l l l l l l l l l l l l l l l l l l l l l l l l l l l l lll
SALINITY
AAIW
LCDW
AABW
STF
SAF
SAF
PF
PF
SF
SB
ASF
b
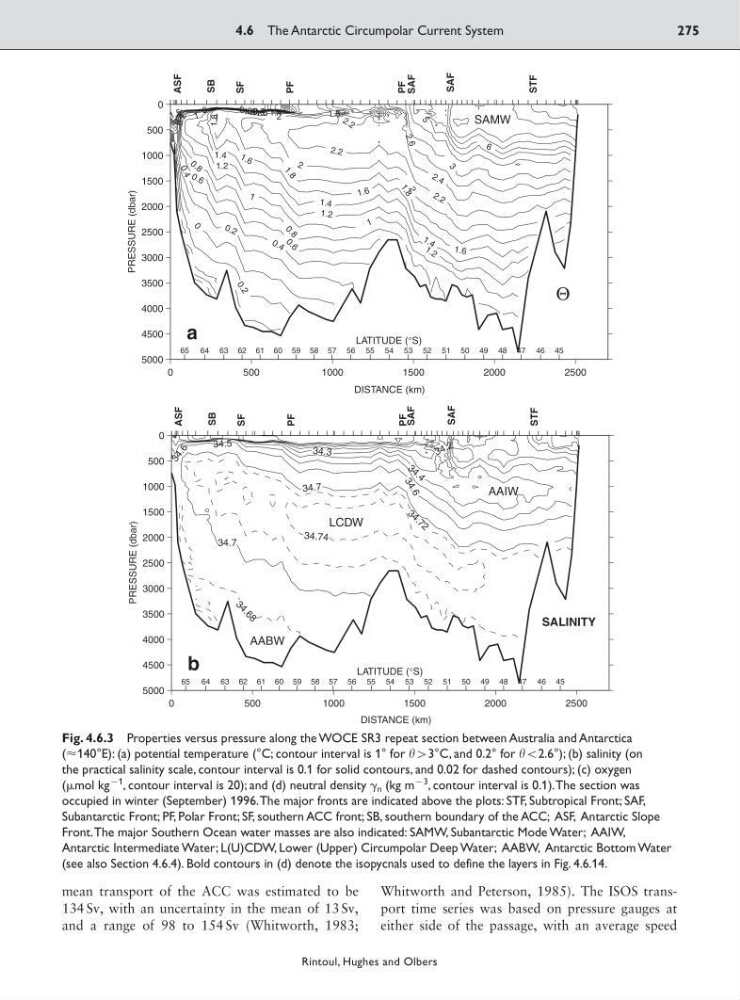
Fig. 4.6.3 Properties versus pressure along the WOCE SR3 repeat section between Australia and Antarctica
(Ϸ140°E): (a) potential temperature (°C; contour interval is 1° for 93°C, and 0.2° for :2.6°); (b) salinity (on
the practical salinity scale, contour interval is 0.1 for solid contours, and 0.02 for dashed contours); (c) oxygen
(mol kg
91
, contour interval is 20); and (d) neutral density ␥ n (kg m
93 , contour interval is 0.1).The section was
occupied in winter (September) 1996.The major fronts are indicated above the plots: STF, Subtropical Front; SAF,
Subantarctic Front; PF, Polar Front; SF, southern ACC front; SB, southern boundary of the ACC; ASF, Antarctic Slope
Front.The major Southern Ocean water masses are also indicated: SAMW, Subantarctic Mode Water; AAIW,
Antarctic Intermediate Water; L(U)CDW, Lower (Upper) Circumpolar Deep Water; AABW, Antarctic Bottom Water
(see also Section 4.6.4). Bold contours in (d) denote the isopycnals used to define the layers in Fig. 4.6.14.
mean transport of the ACC was estimated to be
134 Sv, with an uncertainty in the mean of 13 Sv,
and a range of 98 to 154 Sv (Whitworth, 1983;
Whitworth and Peterson, 1985). The ISOS transport time series was based on pressure gauges at
either side of the passage, with an average speed
275
Rintoul, Hughes and Olbers
0
500
1000
1500
2000
2500
0
500
1000
1500
2000
2500
3000
3500
4000
4500
5000
DISTANCE (km)
PRESSURE (dbar)
1 .5
0 . 4
0
.
2
0
0
0 .2
0 .2
0 .4
0 .4
0.4
0 . 6
0 .6
0.6
0 . 8
0 . 8
0.8
1
1
1
1 . 2
1.2
1.2
1.2
1 .4
1.4
1.4
1.4
1. 6
1. 6
1 .6
1.6
1 . 8
1 . 8
1.8
1.8
2
2
2
2 .2
2. 2
2 .2
2 .4
2 .6
3
5
6
45
46
47
48
49
50
51
52
53
54
55
56
57
58
59
60
61
62
63
64
65
l
l
l
l
l
l
l
l
l
l
l
l
l
l
l
l
l
l
l
l
l
LATITUDE (°S)
l lll l l l
l l l l l l l l l l l l l l l l l l l l l l l l l l l l l l l l l l l l l l l l l l l l l l l lll
Θ
SAMW
STF
SAF
SAF
PF
PF
SF
SB
ASF
a
0
500
1000
1500
2000
2500
0
500
1000
1500
2000
2500
3000
3500
4000
4500
5000
DISTANCE (km)
PRESSURE (dbar)
3 4 .2
34. 3
3 4 . 4
34.5
3
4
.
6
3 4 . 6
34.7
34. 7
3 4 . 7 2
34.7 4
3
4
.
6
8
45
46
47
48
49
50
51
52
53
54
55
56
57
58
59
60
61
62
63
64
65
l
l
l
l
l
l
l
l
l
l
l
l
l
l
l
l
l
l
l
l
l
LATITUDE (°S)
l lll l l l
l l l l l l l l l l l l l l l l l l l l l l l l l l l l l l l l l l l l l l l l l l l l l l l lll
SALINITY
AAIW
LCDW
AABW
STF
SAF
SAF
PF
PF
SF
SB
ASF
b
Fig. 4.6.3 Properties versus pressure along the WOCE SR3 repeat section between Australia and Antarctica
(Ϸ140°E): (a) potential temperature (°C; contour interval is 1° for 93°C, and 0.2° for :2.6°); (b) salinity (on
the practical salinity scale, contour interval is 0.1 for solid contours, and 0.02 for dashed contours); (c) oxygen
(mol kg
91
, contour interval is 20); and (d) neutral density ␥ n (kg m
93 , contour interval is 0.1).The section was
occupied in winter (September) 1996.The major fronts are indicated above the plots: STF, Subtropical Front; SAF,
Subantarctic Front; PF, Polar Front; SF, southern ACC front; SB, southern boundary of the ACC; ASF, Antarctic Slope
Front.The major Southern Ocean water masses are also indicated: SAMW, Subantarctic Mode Water; AAIW,
Antarctic Intermediate Water; L(U)CDW, Lower (Upper) Circumpolar Deep Water; AABW, Antarctic Bottom Water
(see also Section 4.6.4). Bold contours in (d) denote the isopycnals used to define the layers in Fig. 4.6.14.
mean transport of the ACC was estimated to be
134 Sv, with an uncertainty in the mean of 13 Sv,
and a range of 98 to 154 Sv (Whitworth, 1983;
Whitworth and Peterson, 1985). The ISOS transport time series was based on pressure gauges at
either side of the passage, with an average speed