

The search for possible dynamical explanations
and/or higher latitude origin of these features is
proceeding in a rather piecemeal fashion, with different explanations offered for different features;
this almost certainly reflects physical reality. In the
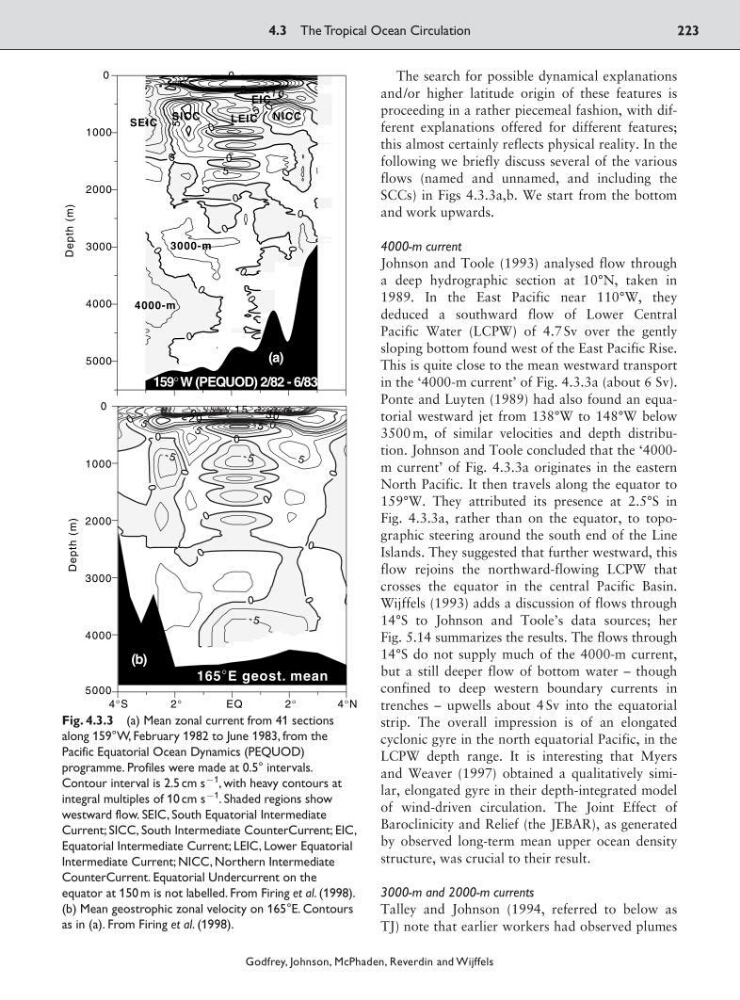
following we briefly discuss several of the various
flows (named and unnamed, and including the
SCCs) in Figs 4.3.3a,b. We start from the bottom
and work upwards.
4000-m current
Johnson and Toole (1993) analysed flow through
a deep hydrographic section at 10°N, taken in
1989. In the East Pacific near 110°W, they
deduced a southward flow of Lower Central
Pacific Water (LCPW) of 4.7 Sv over the gently
sloping bottom found west of the East Pacific Rise.
This is quite close to the mean westward transport
in the ‘4000-m current’ of Fig. 4.3.3a (about 6 Sv).
Ponte and Luyten (1989) had also found an equatorial westward jet from 138°W to 148°W below
3500 m, of similar velocities and depth distribution. Johnson and Toole concluded that the ‘4000m current’ of Fig. 4.3.3a originates in the eastern
North Pacific. It then travels along the equator to
159°W. They attributed its presence at 2.5°S in
Fig. 4.3.3a, rather than on the equator, to topographic steering around the south end of the Line
Islands. They suggested that further westward, this
flow rejoins the northward-flowing LCPW that
crosses the equator in the central Pacific Basin.
Wijffels (1993) adds a discussion of flows through
14°S to Johnson and Toole’s data sources; her
Fig. 5.14 summarizes the results. The flows through
14°S do not supply much of the 4000-m current,
but a still deeper flow of bottom water – though
confined to deep western boundary currents in
trenches – upwells about 4 Sv into the equatorial
strip. The overall impression is of an elongated
cyclonic gyre in the north equatorial Pacific, in the
LCPW depth range. It is interesting that Myers
and Weaver (1997) obtained a qualitatively similar, elongated gyre in their depth-integrated model
of wind-driven circulation. The Joint Effect of
Baroclinicity and Relief (the JEBAR), as generated
by observed long-term mean upper ocean density
structure, was crucial to their result.
3000-m and 2000-m currents
Talley and Johnson (1994, referred to below as
TJ) note that earlier workers had observed plumes
4.3 The Tropical Ocean Circulation
223
Godfrey, Johnson, McPhaden, Reverdin and Wijffels
4°S
2°
EQ
2°
4°N
5000
4000
3000
2000
1000
0
Depth (m)
0
0
- 5
0
0
0
0
0
0
0
- 5
- 5
5
0
0
0
0
0
0
- 5
5
5
1 5
2 0
3 0
5000
4000
3000
2000
1000
0
Depth (m)
0
0
0
0
0
0
0
0
0
0
0
0
0
5
0
0
0
- 1 0
- 5
5
0
SEIC
SICC
NICC
3000-m
4000-m
EIC
LEIC
159°W (PEQUOD) 2/82 - 6/83
(a)
(b)
165 °E geost. mean
Fig. 4.3.3 (a) Mean zonal current from 41 sections
along 159°W, February 1982 to June 1983, from the
Pacific Equatorial Ocean Dynamics (PEQUOD)
programme. Profiles were made at 0.5° intervals.
Contour interval is 2.5 cm s
91
, with heavy contours at
integral multiples of 10 cm s
91
. Shaded regions show
westward flow. SEIC, South Equatorial Intermediate
Current; SICC, South Intermediate CounterCurrent; EIC,
Equatorial Intermediate Current; LEIC, Lower Equatorial
Intermediate Current; NICC, Northern Intermediate
CounterCurrent. Equatorial Undercurrent on the
equator at 150 m is not labelled. From Firing et al. (1998).
(b) Mean geostrophic zonal velocity on 165°E. Contours
as in (a). From Firing et al. (1998).
and/or higher latitude origin of these features is
proceeding in a rather piecemeal fashion, with different explanations offered for different features;
this almost certainly reflects physical reality. In the
following we briefly discuss several of the various
flows (named and unnamed, and including the
SCCs) in Figs 4.3.3a,b. We start from the bottom
and work upwards.
4000-m current
Johnson and Toole (1993) analysed flow through
a deep hydrographic section at 10°N, taken in
1989. In the East Pacific near 110°W, they
deduced a southward flow of Lower Central
Pacific Water (LCPW) of 4.7 Sv over the gently
sloping bottom found west of the East Pacific Rise.
This is quite close to the mean westward transport
in the ‘4000-m current’ of Fig. 4.3.3a (about 6 Sv).
Ponte and Luyten (1989) had also found an equatorial westward jet from 138°W to 148°W below
3500 m, of similar velocities and depth distribution. Johnson and Toole concluded that the ‘4000m current’ of Fig. 4.3.3a originates in the eastern
North Pacific. It then travels along the equator to
159°W. They attributed its presence at 2.5°S in
Fig. 4.3.3a, rather than on the equator, to topographic steering around the south end of the Line
Islands. They suggested that further westward, this
flow rejoins the northward-flowing LCPW that
crosses the equator in the central Pacific Basin.
Wijffels (1993) adds a discussion of flows through
14°S to Johnson and Toole’s data sources; her
Fig. 5.14 summarizes the results. The flows through
14°S do not supply much of the 4000-m current,
but a still deeper flow of bottom water – though
confined to deep western boundary currents in
trenches – upwells about 4 Sv into the equatorial
strip. The overall impression is of an elongated
cyclonic gyre in the north equatorial Pacific, in the
LCPW depth range. It is interesting that Myers
and Weaver (1997) obtained a qualitatively similar, elongated gyre in their depth-integrated model
of wind-driven circulation. The Joint Effect of
Baroclinicity and Relief (the JEBAR), as generated
by observed long-term mean upper ocean density
structure, was crucial to their result.
3000-m and 2000-m currents
Talley and Johnson (1994, referred to below as
TJ) note that earlier workers had observed plumes
4.3 The Tropical Ocean Circulation
223
Godfrey, Johnson, McPhaden, Reverdin and Wijffels
4°S
2°
EQ
2°
4°N
5000
4000
3000
2000
1000
0
Depth (m)
0
0
- 5
0
0
0
0
0
0
0
- 5
- 5
5
0
0
0
0
0
0
- 5
5
5
1 5
2 0
3 0
5000
4000
3000
2000
1000
0
Depth (m)
0
0
0
0
0
0
0
0
0
0
0
0
0
5
0
0
0
- 1 0
- 5
5
0
SEIC
SICC
NICC
3000-m
4000-m
EIC
LEIC
159°W (PEQUOD) 2/82 - 6/83
(a)
(b)
165 °E geost. mean
Fig. 4.3.3 (a) Mean zonal current from 41 sections
along 159°W, February 1982 to June 1983, from the
Pacific Equatorial Ocean Dynamics (PEQUOD)
programme. Profiles were made at 0.5° intervals.
Contour interval is 2.5 cm s
91
, with heavy contours at
integral multiples of 10 cm s
91
. Shaded regions show
westward flow. SEIC, South Equatorial Intermediate
Current; SICC, South Intermediate CounterCurrent; EIC,
Equatorial Intermediate Current; LEIC, Lower Equatorial
Intermediate Current; NICC, Northern Intermediate
CounterCurrent. Equatorial Undercurrent on the
equator at 150 m is not labelled. From Firing et al. (1998).
(b) Mean geostrophic zonal velocity on 165°E. Contours
as in (a). From Firing et al. (1998).