

thus provides an attractive approach to measuring
the mean-sea-level change. However, the small signal (ϳ1 mm yr
91
) presents a formidable challenge
to the capability of altimetry measurement system.
All the attempts at estimating mean sea level using
altimetry data collected before T/P basically testified the degree of difficulty of the problem (Born
et al., 1986; Wagner and Cheney, 1992).
After the demonstration of the much improved
measurement accuracy of T/P, it became tantalizing
to tackle the problem of mean sea level using the
T/P data. The first attempt (Nerem, 1995) actually
triggered the discovery of a software error in the
data processing system, which had caused an erroneous large sea-level rise in the calculation. This
problem was first revealed by comparison with tide
gauge observations (Nerem et al., 1997; Mitchum,
1998), as well as intercomparison between the two
altimeters onboard T/P. This experience has further
demonstrated the importance of independent calibration of altimetry measurement. Mitchum (1998)
calculated the difference in sea-level measurements
between T/P and nearby tide gauges. Such calculation was performed at nearly 100 tide gauges and a
global mean of the differences was then obtained
and used to calibrate out any drifts in the altimetry
measurement of global mean sea level. Shown in
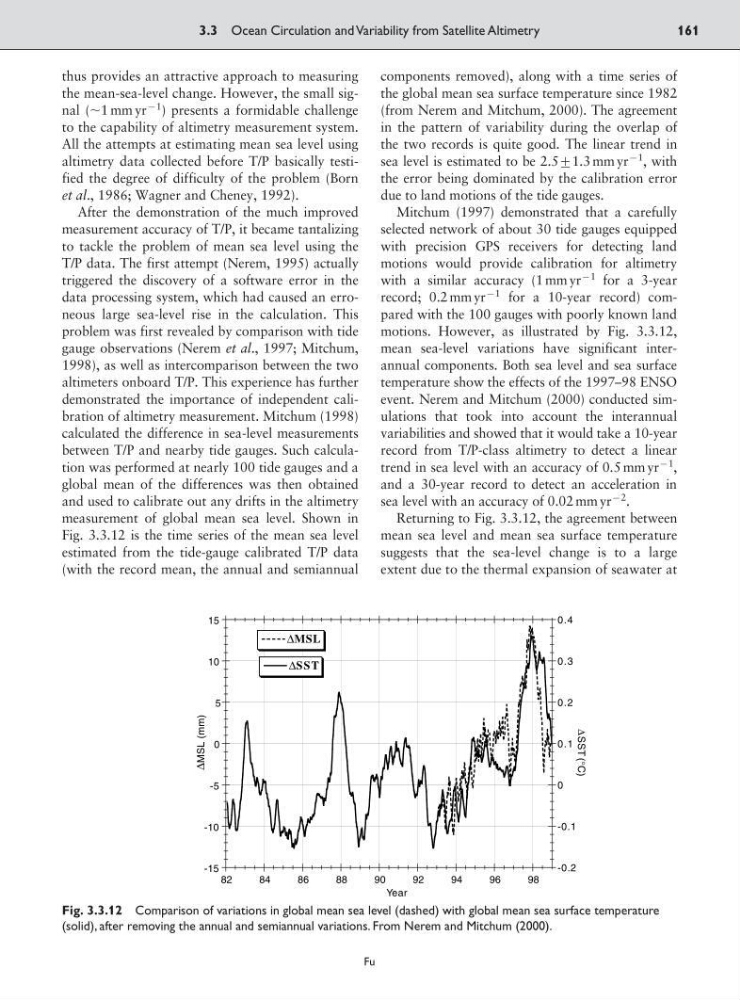
Fig. 3.3.12 is the time series of the mean sea level
estimated from the tide-gauge calibrated T/P data
(with the record mean, the annual and semiannual
components removed), along with a time series of
the global mean sea surface temperature since 1982
(from Nerem and Mitchum, 2000). The agreement
in the pattern of variability during the overlap of
the two records is quite good. The linear trend in
sea level is estimated to be 2.5<1.3 mm yr
91
, with
the error being dominated by the calibration error
due to land motions of the tide gauges.
Mitchum (1997) demonstrated that a carefully
selected network of about 30 tide gauges equipped
with precision GPS receivers for detecting land
motions would provide calibration for altimetry
with a similar accuracy (1 mm yr
91 for a 3-year
record; 0.2 mm yr
91 for a 10-year record) compared with the 100 gauges with poorly known land
motions. However, as illustrated by Fig. 3.3.12,
mean sea-level variations have significant interannual components. Both sea level and sea surface
temperature show the effects of the 1997–98 ENSO
event. Nerem and Mitchum (2000) conducted simulations that took into account the interannual
variabilities and showed that it would take a 10-year
record from T/P-class altimetry to detect a linear
trend in sea level with an accuracy of 0.5 mm yr
91
,
and a 30-year record to detect an acceleration in
sea level with an accuracy of 0.02 mm yr
92
.
Returning to Fig. 3.3.12, the agreement between
mean sea level and mean sea surface temperature
suggests that the sea-level change is to a large
extent due to the thermal expansion of seawater at
3.3 Ocean Circulation and Variability from Satellite Altimetry
161
Fu
-15
-10
-5
0
5
10
15
-0.2
-0.1
0
0.1
0.2
0.3
0.4
82
84
86
88
90
92
94
96
98
ΔMSL
ΔSST
ΔMSL (mm)
ΔSST (°C)
Year
Fig. 3.3.12 Comparison of variations in global mean sea level (dashed) with global mean sea surface temperature
(solid), after removing the annual and semiannual variations. From Nerem and Mitchum (2000).
the mean-sea-level change. However, the small signal (ϳ1 mm yr
91
) presents a formidable challenge
to the capability of altimetry measurement system.
All the attempts at estimating mean sea level using
altimetry data collected before T/P basically testified the degree of difficulty of the problem (Born
et al., 1986; Wagner and Cheney, 1992).
After the demonstration of the much improved
measurement accuracy of T/P, it became tantalizing
to tackle the problem of mean sea level using the
T/P data. The first attempt (Nerem, 1995) actually
triggered the discovery of a software error in the
data processing system, which had caused an erroneous large sea-level rise in the calculation. This
problem was first revealed by comparison with tide
gauge observations (Nerem et al., 1997; Mitchum,
1998), as well as intercomparison between the two
altimeters onboard T/P. This experience has further
demonstrated the importance of independent calibration of altimetry measurement. Mitchum (1998)
calculated the difference in sea-level measurements
between T/P and nearby tide gauges. Such calculation was performed at nearly 100 tide gauges and a
global mean of the differences was then obtained
and used to calibrate out any drifts in the altimetry
measurement of global mean sea level. Shown in
Fig. 3.3.12 is the time series of the mean sea level
estimated from the tide-gauge calibrated T/P data
(with the record mean, the annual and semiannual
components removed), along with a time series of
the global mean sea surface temperature since 1982
(from Nerem and Mitchum, 2000). The agreement
in the pattern of variability during the overlap of
the two records is quite good. The linear trend in
sea level is estimated to be 2.5<1.3 mm yr
91
, with
the error being dominated by the calibration error
due to land motions of the tide gauges.
Mitchum (1997) demonstrated that a carefully
selected network of about 30 tide gauges equipped
with precision GPS receivers for detecting land
motions would provide calibration for altimetry
with a similar accuracy (1 mm yr
91 for a 3-year
record; 0.2 mm yr
91 for a 10-year record) compared with the 100 gauges with poorly known land
motions. However, as illustrated by Fig. 3.3.12,
mean sea-level variations have significant interannual components. Both sea level and sea surface
temperature show the effects of the 1997–98 ENSO
event. Nerem and Mitchum (2000) conducted simulations that took into account the interannual
variabilities and showed that it would take a 10-year
record from T/P-class altimetry to detect a linear
trend in sea level with an accuracy of 0.5 mm yr
91
,
and a 30-year record to detect an acceleration in
sea level with an accuracy of 0.02 mm yr
92
.
Returning to Fig. 3.3.12, the agreement between
mean sea level and mean sea surface temperature
suggests that the sea-level change is to a large
extent due to the thermal expansion of seawater at
3.3 Ocean Circulation and Variability from Satellite Altimetry
161
Fu
-15
-10
-5
0
5
10
15
-0.2
-0.1
0
0.1
0.2
0.3
0.4
82
84
86
88
90
92
94
96
98
ΔMSL
ΔSST
ΔMSL (mm)
ΔSST (°C)
Year
Fig. 3.3.12 Comparison of variations in global mean sea level (dashed) with global mean sea surface temperature
(solid), after removing the annual and semiannual variations. From Nerem and Mitchum (2000).