

SECTION 3 NEW WAYS OF OBSERVING THE OCEAN
156
-4 0
-20
-20
- 2 0
-2 0
- 2 0
0
0
0
0
0
0
0
0
0
0
0
0
0
2 0
2 0
2 0
40
40
6 0
OCT
JAN
APR
JUL
OCT
JAN
APR
JUL
OCT
JAN
APR
JUL
OCT
JAN
APR
JUL
OCT
JAN
APR
JUL
OCT
JAN
APR
JUL
130°E
180°
80°W
1993
1994
1995
1996
1997
KELVIN (T/P)
-20
-2 0
- 2 0
-20
- 2 0
0
0
0
0
0
0
0
0
0
0
2 0
2 0
2 0
2 0
20
4 0
4 0
180°
ROSSBY1 (T/P)
-4 0
-20
-20
- 2 0
-2 0
- 2 0
0
0
0
0
0
0
0
0
0
0
0
0
0
2 0
2 0
2 0
40
40
6 0
KELVIN (T/P)
130°E
180°
80°W
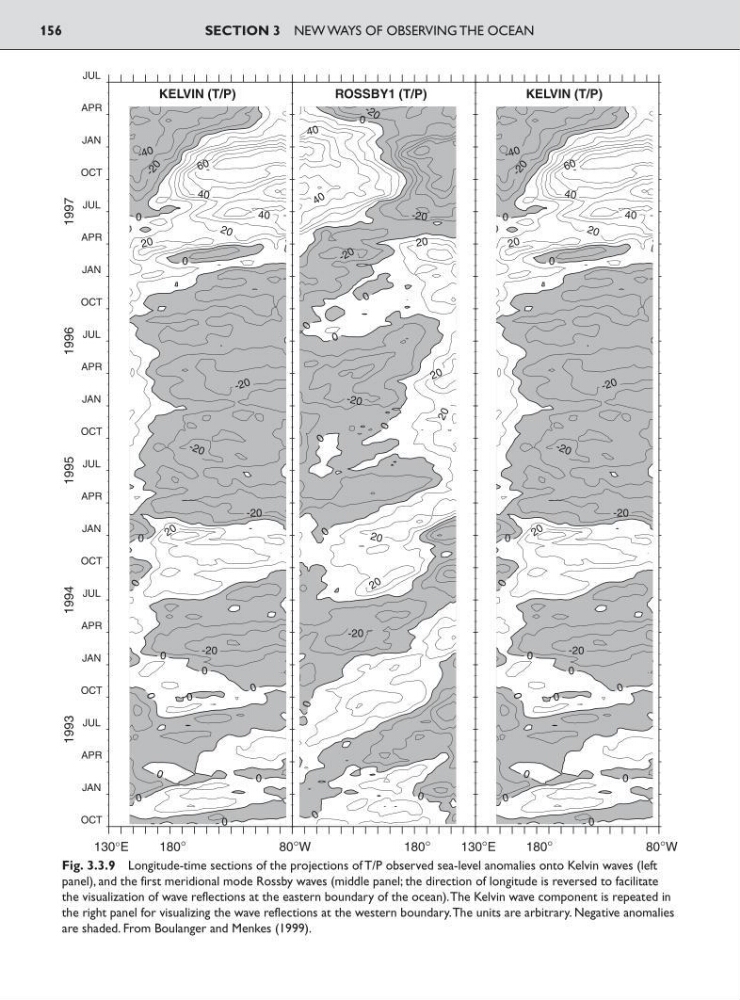
Fig. 3.3.9 Longitude-time sections of the projections of T/P observed sea-level anomalies onto Kelvin waves (left
panel), and the first meridional mode Rossby waves (middle panel; the direction of longitude is reversed to facilitate
the visualization of wave reflections at the eastern boundary of the ocean).The Kelvin wave component is repeated in
the right panel for visualizing the wave reflections at the western boundary.The units are arbitrary. Negative anomalies
are shaded. From Boulanger and Menkes (1999).
156
-4 0
-20
-20
- 2 0
-2 0
- 2 0
0
0
0
0
0
0
0
0
0
0
0
0
0
2 0
2 0
2 0
40
40
6 0
OCT
JAN
APR
JUL
OCT
JAN
APR
JUL
OCT
JAN
APR
JUL
OCT
JAN
APR
JUL
OCT
JAN
APR
JUL
OCT
JAN
APR
JUL
130°E
180°
80°W
1993
1994
1995
1996
1997
KELVIN (T/P)
-20
-2 0
- 2 0
-20
- 2 0
0
0
0
0
0
0
0
0
0
0
2 0
2 0
2 0
2 0
20
4 0
4 0
180°
ROSSBY1 (T/P)
-4 0
-20
-20
- 2 0
-2 0
- 2 0
0
0
0
0
0
0
0
0
0
0
0
0
0
2 0
2 0
2 0
40
40
6 0
KELVIN (T/P)
130°E
180°
80°W
Fig. 3.3.9 Longitude-time sections of the projections of T/P observed sea-level anomalies onto Kelvin waves (left
panel), and the first meridional mode Rossby waves (middle panel; the direction of longitude is reversed to facilitate
the visualization of wave reflections at the eastern boundary of the ocean).The Kelvin wave component is repeated in
the right panel for visualizing the wave reflections at the western boundary.The units are arbitrary. Negative anomalies
are shaded. From Boulanger and Menkes (1999).