

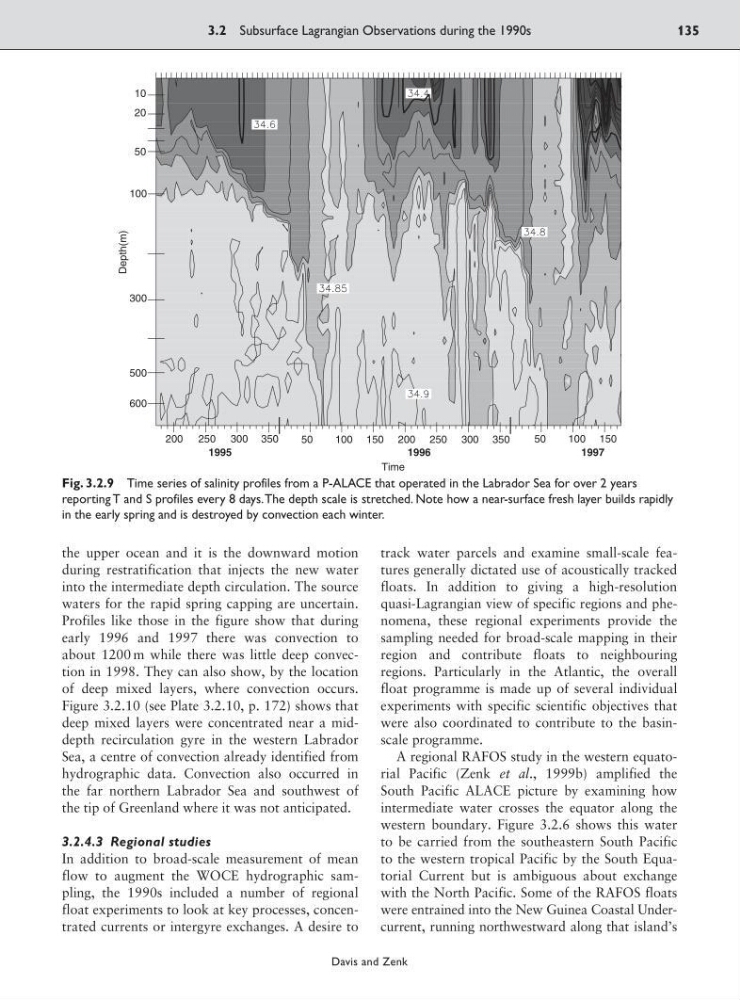
the upper ocean and it is the downward motion
during restratification that injects the new water
into the intermediate depth circulation. The source
waters for the rapid spring capping are uncertain.
Profiles like those in the figure show that during
early 1996 and 1997 there was convection to
about 1200 m while there was little deep convection in 1998. They can also show, by the location
of deep mixed layers, where convection occurs.
Figure 3.2.10 (see Plate 3.2.10, p. 172) shows that
deep mixed layers were concentrated near a middepth recirculation gyre in the western Labrador
Sea, a centre of convection already identified from
hydrographic data. Convection also occurred in
the far northern Labrador Sea and southwest of
the tip of Greenland where it was not anticipated.
3.2.4.3 Regional studies
In addition to broad-scale measurement of mean
flow to augment the WOCE hydrographic sampling, the 1990s included a number of regional
float experiments to look at key processes, concentrated currents or intergyre exchanges. A desire to
track water parcels and examine small-scale features generally dictated use of acoustically tracked
floats. In addition to giving a high-resolution
quasi-Lagrangian view of specific regions and phenomena, these regional experiments provide the
sampling needed for broad-scale mapping in their
region and contribute floats to neighbouring
regions. Particularly in the Atlantic, the overall
float programme is made up of several individual
experiments with specific scientific objectives that
were also coordinated to contribute to the basinscale programme.
A regional RAFOS study in the western equatorial Pacific (Zenk et al., 1999b) amplified the
South Pacific ALACE picture by examining how
intermediate water crosses the equator along the
western boundary. Figure 3.2.6 shows this water
to be carried from the southeastern South Pacific
to the western tropical Pacific by the South Equatorial Current but is ambiguous about exchange
with the North Pacific. Some of the RAFOS floats
were entrained into the New Guinea Coastal Undercurrent, running northwestward along that island’s
3.2 Subsurface Lagrangian Observations during the 1990s
135
Davis and Zenk
10
20
50
100
300
500
600
Depth(m)
200
200
100
250
250
150
50
100 150
50
300
300
350
350
1997
1996
1995
Time
Fig. 3.2.9 Time series of salinity profiles from a P-ALACE that operated in the Labrador Sea for over 2 years
reporting T and S profiles every 8 days.The depth scale is stretched. Note how a near-surface fresh layer builds rapidly
in the early spring and is destroyed by convection each winter.
during restratification that injects the new water
into the intermediate depth circulation. The source
waters for the rapid spring capping are uncertain.
Profiles like those in the figure show that during
early 1996 and 1997 there was convection to
about 1200 m while there was little deep convection in 1998. They can also show, by the location
of deep mixed layers, where convection occurs.
Figure 3.2.10 (see Plate 3.2.10, p. 172) shows that
deep mixed layers were concentrated near a middepth recirculation gyre in the western Labrador
Sea, a centre of convection already identified from
hydrographic data. Convection also occurred in
the far northern Labrador Sea and southwest of
the tip of Greenland where it was not anticipated.
3.2.4.3 Regional studies
In addition to broad-scale measurement of mean
flow to augment the WOCE hydrographic sampling, the 1990s included a number of regional
float experiments to look at key processes, concentrated currents or intergyre exchanges. A desire to
track water parcels and examine small-scale features generally dictated use of acoustically tracked
floats. In addition to giving a high-resolution
quasi-Lagrangian view of specific regions and phenomena, these regional experiments provide the
sampling needed for broad-scale mapping in their
region and contribute floats to neighbouring
regions. Particularly in the Atlantic, the overall
float programme is made up of several individual
experiments with specific scientific objectives that
were also coordinated to contribute to the basinscale programme.
A regional RAFOS study in the western equatorial Pacific (Zenk et al., 1999b) amplified the
South Pacific ALACE picture by examining how
intermediate water crosses the equator along the
western boundary. Figure 3.2.6 shows this water
to be carried from the southeastern South Pacific
to the western tropical Pacific by the South Equatorial Current but is ambiguous about exchange
with the North Pacific. Some of the RAFOS floats
were entrained into the New Guinea Coastal Undercurrent, running northwestward along that island’s
3.2 Subsurface Lagrangian Observations during the 1990s
135
Davis and Zenk
10
20
50
100
300
500
600
Depth(m)
200
200
100
250
250
150
50
100 150
50
300
300
350
350
1997
1996
1995
Time
Fig. 3.2.9 Time series of salinity profiles from a P-ALACE that operated in the Labrador Sea for over 2 years
reporting T and S profiles every 8 days.The depth scale is stretched. Note how a near-surface fresh layer builds rapidly
in the early spring and is destroyed by convection each winter.