

consequently, some regions were not sampled as
planned. Partially compensating for this were local
deployments by scientists outside WOCE. Since
the WOCE float sampling density was matched to
the density of hydrographic observations, it was
feasible to deploy many of the floats from the
WOCE Hydrographic Programme (WHP) cruises
and the scientists of the WHP deserve much of the
credit for the efficiency of the float programme.
While initial analyses of WOCE floats are
expected to be done by those who deployed them,
ultimately the complete data set will be collected
and made public. To begin this process, a Float
Data Assembly Center established at the Woods
Hole Oceanographic Institution is gathering all
available float data, both from the WOCE era and
before. On its web site http://www.whoi.edu/science/
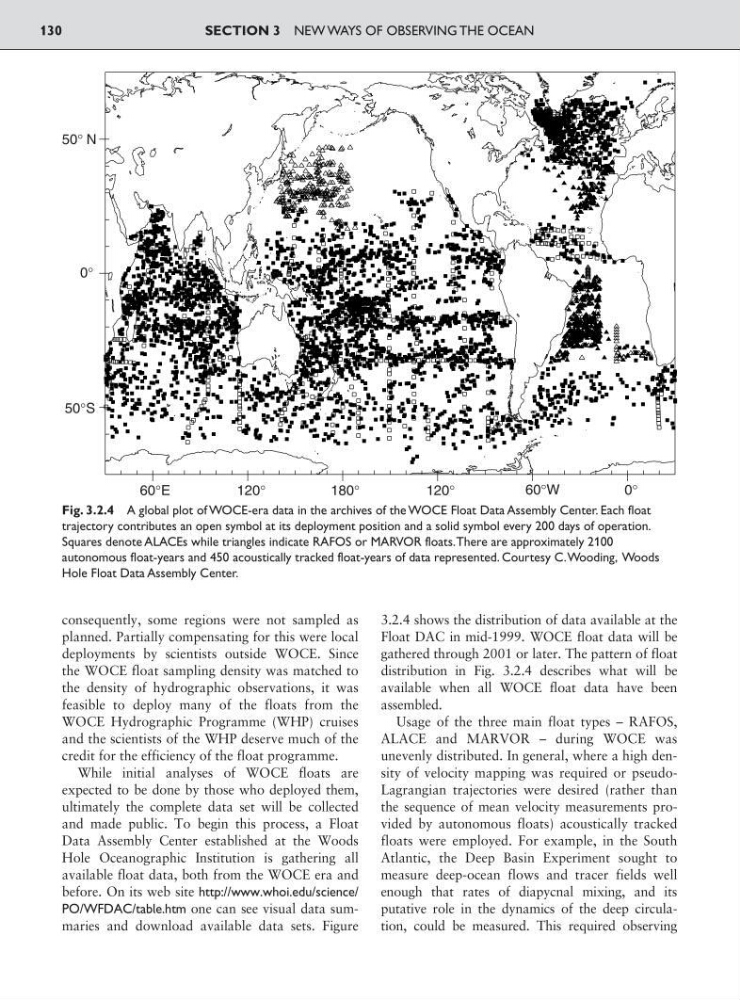
PO/WFDAC/table.htm one can see visual data summaries and download available data sets. Figure
3.2.4 shows the distribution of data available at the
Float DAC in mid-1999. WOCE float data will be
gathered through 2001 or later. The pattern of float
distribution in Fig. 3.2.4 describes what will be
available when all WOCE float data have been
assembled.
Usage of the three main float types – RAFOS,
ALACE and MARVOR – during WOCE was
unevenly distributed. In general, where a high density of velocity mapping was required or pseudoLagrangian trajectories were desired (rather than
the sequence of mean velocity measurements provided by autonomous floats) acoustically tracked
floats were employed. For example, in the South
Atlantic, the Deep Basin Experiment sought to
measure deep-ocean flows and tracer fields well
enough that rates of diapycnal mixing, and its
putative role in the dynamics of the deep circulation, could be measured. This required observing
SECTION 3 NEW WAYS OF OBSERVING THE OCEAN
130
50° N
50°S
0°
0°
60°E
60°W
120°
120°
180°
Fig. 3.2.4 A global plot of WOCE-era data in the archives of the WOCE Float Data Assembly Center. Each float
trajectory contributes an open symbol at its deployment position and a solid symbol every 200 days of operation.
Squares denote ALACEs while triangles indicate RAFOS or MARVOR floats.There are approximately 2100
autonomous float-years and 450 acoustically tracked float-years of data represented. Courtesy C.Wooding, Woods
Hole Float Data Assembly Center.
planned. Partially compensating for this were local
deployments by scientists outside WOCE. Since
the WOCE float sampling density was matched to
the density of hydrographic observations, it was
feasible to deploy many of the floats from the
WOCE Hydrographic Programme (WHP) cruises
and the scientists of the WHP deserve much of the
credit for the efficiency of the float programme.
While initial analyses of WOCE floats are
expected to be done by those who deployed them,
ultimately the complete data set will be collected
and made public. To begin this process, a Float
Data Assembly Center established at the Woods
Hole Oceanographic Institution is gathering all
available float data, both from the WOCE era and
before. On its web site http://www.whoi.edu/science/
PO/WFDAC/table.htm one can see visual data summaries and download available data sets. Figure
3.2.4 shows the distribution of data available at the
Float DAC in mid-1999. WOCE float data will be
gathered through 2001 or later. The pattern of float
distribution in Fig. 3.2.4 describes what will be
available when all WOCE float data have been
assembled.
Usage of the three main float types – RAFOS,
ALACE and MARVOR – during WOCE was
unevenly distributed. In general, where a high density of velocity mapping was required or pseudoLagrangian trajectories were desired (rather than
the sequence of mean velocity measurements provided by autonomous floats) acoustically tracked
floats were employed. For example, in the South
Atlantic, the Deep Basin Experiment sought to
measure deep-ocean flows and tracer fields well
enough that rates of diapycnal mixing, and its
putative role in the dynamics of the deep circulation, could be measured. This required observing
SECTION 3 NEW WAYS OF OBSERVING THE OCEAN
130
50° N
50°S
0°
0°
60°E
60°W
120°
120°
180°
Fig. 3.2.4 A global plot of WOCE-era data in the archives of the WOCE Float Data Assembly Center. Each float
trajectory contributes an open symbol at its deployment position and a solid symbol every 200 days of operation.
Squares denote ALACEs while triangles indicate RAFOS or MARVOR floats.There are approximately 2100
autonomous float-years and 450 acoustically tracked float-years of data represented. Courtesy C.Wooding, Woods
Hole Float Data Assembly Center.