

3 measurement of both velocity components, also
in contrast to geostrophic sections;
4 low marginal cost, leading to a large data set.
The weaknesses are:
1 accuracy limitations, particularly with respect to
transport integrated over long sections (SADCP
and LADCP), and with respect to the large-scale
structure of the LADCP profile;
2 sensitivity to adverse environmental conditions:
bad weather or inadequate populations of
scatterers.
Another crucial characteristic is a strength for
some applications and a weakness for others: the
measurement of ageostrophic as well as geostrophic
velocity components. The barotropic tidal currents,
for example, are usually viewed as noise in open
ocean current measurements. To reduce this source
of noise in shipboard or lowered ADCP profiles,
one may subtract the tidal currents estimated from
a model based on satellite altimetry (e.g. Egbert,
1997), as done by Donohue et al. (2000a). Baroclinic tides are usually a larger noise source in
SADCP measurements than barotropic tides, but
they cannot generally be modelled well enough
to be removed. Given a suitable repeated survey
pattern, however, they can be estimated from
the measurements themselves, and thus partially
removed (Feng et al., 1998a).
The most straightforward application of ADCP
measurements, and one that takes advantage of all
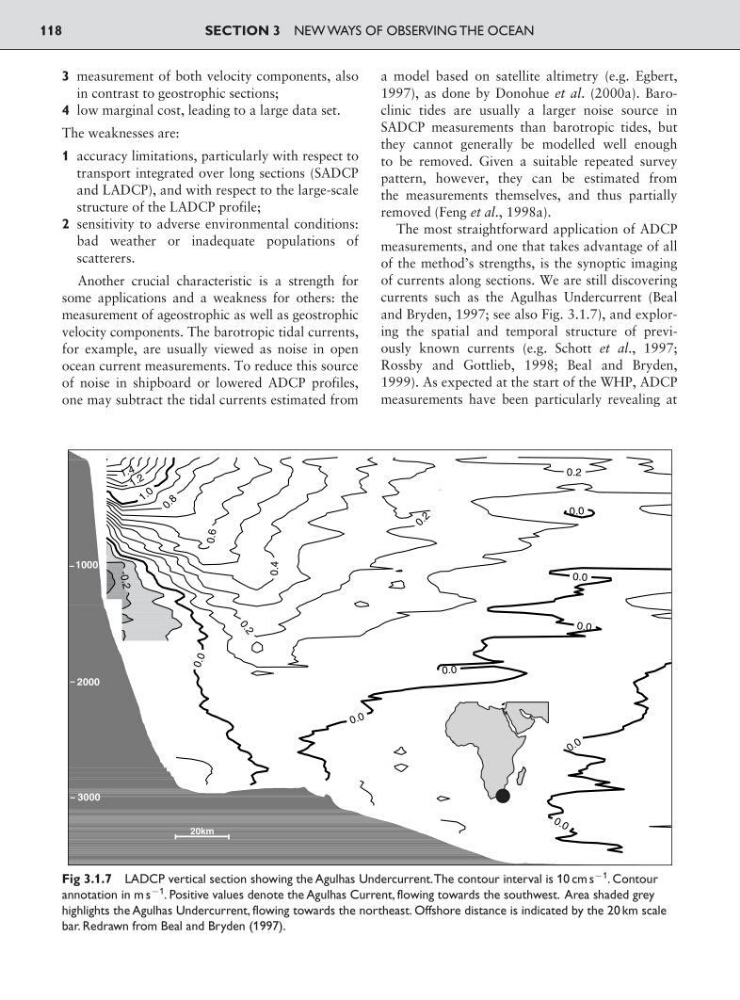
of the method’s strengths, is the synoptic imaging
of currents along sections. We are still discovering
currents such as the Agulhas Undercurrent (Beal
and Bryden, 1997; see also Fig. 3.1.7), and exploring the spatial and temporal structure of previously known currents (e.g. Schott et al., 1997;
Rossby and Gottlieb, 1998; Beal and Bryden,
1999). As expected at the start of the WHP, ADCP
measurements have been particularly revealing at
SECTION 3 NEW WAYS OF OBSERVING THE OCEAN
118
-0
.2
0 .0
0
.
2
0 . 2
0.4
0. 6
0 . 8
1 . 0
1 . 2
1 .4
0.0
0.0
0.0
0 .0
0.2
0 . 0
0 . 0
0.0
1000
2000
3000
20km
Fig 3.1.7 LADCP vertical section showing the Agulhas Undercurrent.The contour interval is 10 cm s
91 . Contour
annotation in m s
91 . Positive values denote the Agulhas Current, flowing towards the southwest. Area shaded grey
highlights the Agulhas Undercurrent, flowing towards the northeast. Offshore distance is indicated by the 20 km scale
bar. Redrawn from Beal and Bryden (1997).
in contrast to geostrophic sections;
4 low marginal cost, leading to a large data set.
The weaknesses are:
1 accuracy limitations, particularly with respect to
transport integrated over long sections (SADCP
and LADCP), and with respect to the large-scale
structure of the LADCP profile;
2 sensitivity to adverse environmental conditions:
bad weather or inadequate populations of
scatterers.
Another crucial characteristic is a strength for
some applications and a weakness for others: the
measurement of ageostrophic as well as geostrophic
velocity components. The barotropic tidal currents,
for example, are usually viewed as noise in open
ocean current measurements. To reduce this source
of noise in shipboard or lowered ADCP profiles,
one may subtract the tidal currents estimated from
a model based on satellite altimetry (e.g. Egbert,
1997), as done by Donohue et al. (2000a). Baroclinic tides are usually a larger noise source in
SADCP measurements than barotropic tides, but
they cannot generally be modelled well enough
to be removed. Given a suitable repeated survey
pattern, however, they can be estimated from
the measurements themselves, and thus partially
removed (Feng et al., 1998a).
The most straightforward application of ADCP
measurements, and one that takes advantage of all
of the method’s strengths, is the synoptic imaging
of currents along sections. We are still discovering
currents such as the Agulhas Undercurrent (Beal
and Bryden, 1997; see also Fig. 3.1.7), and exploring the spatial and temporal structure of previously known currents (e.g. Schott et al., 1997;
Rossby and Gottlieb, 1998; Beal and Bryden,
1999). As expected at the start of the WHP, ADCP
measurements have been particularly revealing at
SECTION 3 NEW WAYS OF OBSERVING THE OCEAN
118
-0
.2
0 .0
0
.
2
0 . 2
0.4
0. 6
0 . 8
1 . 0
1 . 2
1 .4
0.0
0.0
0.0
0 .0
0.2
0 . 0
0 . 0
0.0
1000
2000
3000
20km
Fig 3.1.7 LADCP vertical section showing the Agulhas Undercurrent.The contour interval is 10 cm s
91 . Contour
annotation in m s
91 . Positive values denote the Agulhas Current, flowing towards the southwest. Area shaded grey
highlights the Agulhas Undercurrent, flowing towards the northeast. Offshore distance is indicated by the 20 km scale
bar. Redrawn from Beal and Bryden (1997).