

a challenging task, since the different sections have
been sampled at different times during the past 20
years (see Schlosser et al., Chapter 5.8). Nonetheless, the tracer data set provides a valuable resource
for evaluating model ventilation rates over decadal
time scales, and increasing use of it is likely to be
made in the future. The implications of such evaluations for future climate projections are discussed
in Section 2.3.6.1.
2.3.5.5 Interannual variability
The El Niño-Southern Oscillation (ENSO) phenomenon is the strongest mode of variability of
the modern climate, on time scales longer than
seasonal, and is believed to result from coupled
interaction of the atmosphere and ocean (Philander,
1990; Neelin et al., 1998). Correct reproduction of
ENSO is therefore a strong test of coupled models.
Many coupled models were developed as part of
the TOGA programme, specifically to study the
ENSO problem (see Delecluse et al., 1998), but
these often involved simplifications (limited ocean
domain, flat bottom) that made them inappropriate for longer-time-scale, global phenomena.
Nonetheless, a number of fully global models
produce ENSO-like variability in SST with realistic
spatial patterns and time scales. Some models
(e.g. Roeckner et al., 1996; Guilyardi and Madec,
1997; Barthelet et al., 1998) include enhanced
resolution in order to resolve the equatorial waveguide. It is perhaps surprising that even some models with very coarse resolution still produce quite
realistic-looking SST variability (e.g. Tett, 1995;
Knutson et al., 1997; Timmerman et al., 1999b;
Collins, 2000), despite the absence of equatorial
waves. Physical mechanisms other than equatorial waves may be at play in ENSO, and such
mechanisms appear to be present in the coarseresolution models (see Neelin et al., 1998, for a
review).
2.3 Coupled Ocean–Atmosphere Models
91
Wood and Bryan
Total
Thermal
Haline
Total
Thermal
Haline
Model
Observed
50
0
-50
-100
Water mass formation rate (Sv)
50
0
-50
-100
Water mass formation rate (Sv)
18
20
22
24
26
28
30
Surface density (kg m –3 )
(a)
(b)
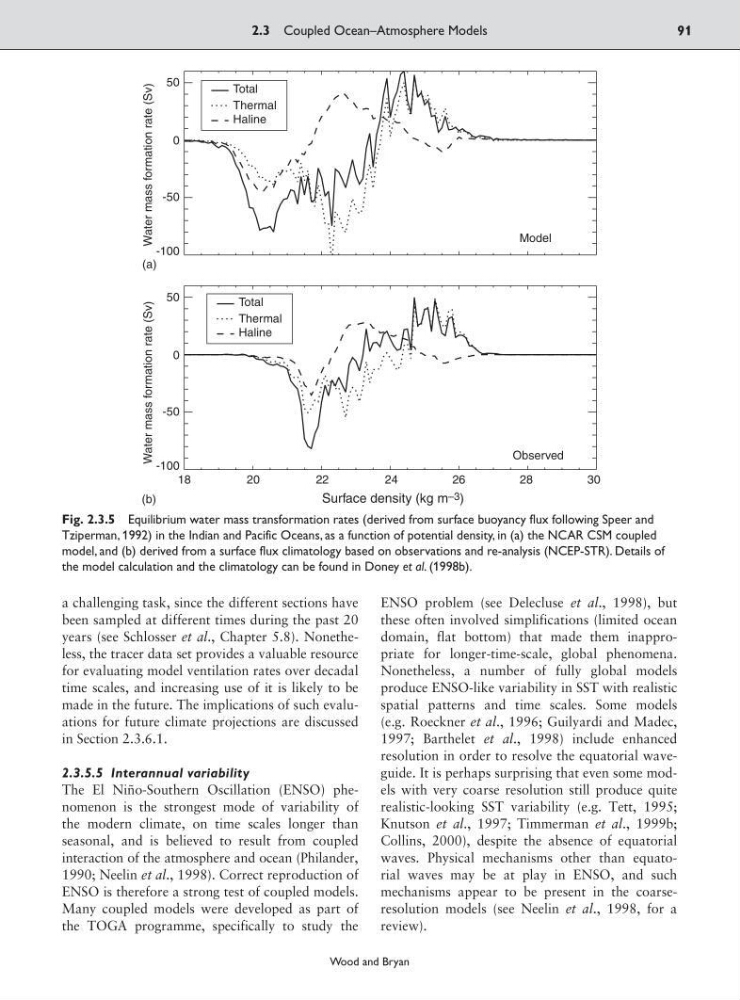
Fig. 2.3.5 Equilibrium water mass transformation rates (derived from surface buoyancy flux following Speer and
Tziperman, 1992) in the Indian and Pacific Oceans, as a function of potential density, in (a) the NCAR CSM coupled
model, and (b) derived from a surface flux climatology based on observations and re-analysis (NCEP-STR). Details of
the model calculation and the climatology can be found in Doney et al. (1998b).
been sampled at different times during the past 20
years (see Schlosser et al., Chapter 5.8). Nonetheless, the tracer data set provides a valuable resource
for evaluating model ventilation rates over decadal
time scales, and increasing use of it is likely to be
made in the future. The implications of such evaluations for future climate projections are discussed
in Section 2.3.6.1.
2.3.5.5 Interannual variability
The El Niño-Southern Oscillation (ENSO) phenomenon is the strongest mode of variability of
the modern climate, on time scales longer than
seasonal, and is believed to result from coupled
interaction of the atmosphere and ocean (Philander,
1990; Neelin et al., 1998). Correct reproduction of
ENSO is therefore a strong test of coupled models.
Many coupled models were developed as part of
the TOGA programme, specifically to study the
ENSO problem (see Delecluse et al., 1998), but
these often involved simplifications (limited ocean
domain, flat bottom) that made them inappropriate for longer-time-scale, global phenomena.
Nonetheless, a number of fully global models
produce ENSO-like variability in SST with realistic
spatial patterns and time scales. Some models
(e.g. Roeckner et al., 1996; Guilyardi and Madec,
1997; Barthelet et al., 1998) include enhanced
resolution in order to resolve the equatorial waveguide. It is perhaps surprising that even some models with very coarse resolution still produce quite
realistic-looking SST variability (e.g. Tett, 1995;
Knutson et al., 1997; Timmerman et al., 1999b;
Collins, 2000), despite the absence of equatorial
waves. Physical mechanisms other than equatorial waves may be at play in ENSO, and such
mechanisms appear to be present in the coarseresolution models (see Neelin et al., 1998, for a
review).
2.3 Coupled Ocean–Atmosphere Models
91
Wood and Bryan
Total
Thermal
Haline
Total
Thermal
Haline
Model
Observed
50
0
-50
-100
Water mass formation rate (Sv)
50
0
-50
-100
Water mass formation rate (Sv)
18
20
22
24
26
28
30
Surface density (kg m –3 )
(a)
(b)
Fig. 2.3.5 Equilibrium water mass transformation rates (derived from surface buoyancy flux following Speer and
Tziperman, 1992) in the Indian and Pacific Oceans, as a function of potential density, in (a) the NCAR CSM coupled
model, and (b) derived from a surface flux climatology based on observations and re-analysis (NCEP-STR). Details of
the model calculation and the climatology can be found in Doney et al. (1998b).