

OXYGEN ISOTOPES IN THE OCEAN
K. K. Turekian, Yale University, New Haven,
CT, USA
Copyright & 2001 Elsevier Ltd.
The oxygen isotope signature of sea water varies as a
function of the processing of water in the oceanic
cycle. The two chemical parameters, salinity and
oxygen isotope ratio, are distinctive for various
water types. The oxygen-18 to oxygen-16 ratio is
represented in comparison to a standard. The notation is dO
18 which is defined as follows:
18 O=
16 O sample
18 O=
16 O standard
À 1
"
#
 1000
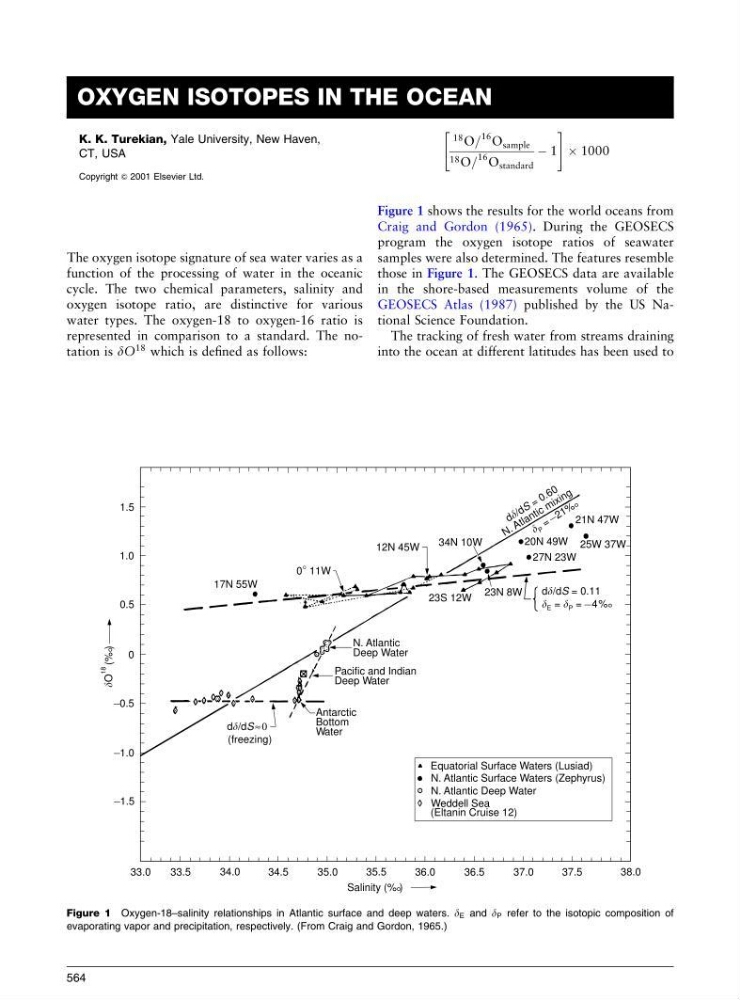
Figure 1 shows the results for the world oceans from
Craig and Gordon (1965). During the GEOSECS
program the oxygen isotope ratios of seawater
samples were also determined. The features resemble
those in Figure 1. The GEOSECS data are available
in the shore-based measurements volume of the
GEOSECS Atlas (1987) published by the US National Science Foundation.
The tracking of fresh water from streams draining
into the ocean at different latitudes has been used to
1.5
1.0
0.5
0
_ 0.5
_ 1.0
_ 1.5
33.0
33.5
34.0
34.5
35.0
35.5
36.0
36.5
37.0
37.5
38.0
Salinity (% )
Equatorial Surface Waters (Lusiad)
N. Atlantic Surface Waters (Zephyrus)
N. Atlantic Deep Water
Weddell Sea
(Eltanin Cruise 12)
d /d
(freezing)
S ≈ 0
Antarctic
Bottom
Water
Pacific and Indian
Deep Water
N. Atlantic
Deep Water
23S 12W
23N 8W
d /d = 0.11
= _ 4%
S
P
E =
27N 23W
20N 49W
21N 47W
25W 37W
=
_ 2 1 %
P
d
= 0 . 6 0
N . A t la n t ic
m ix in g
/ d S
34N 10W
12N 45W
0 11W
°
17N 55W
O (% )
18
Figure 1 Oxygen-18–salinity relationships in Atlantic surface and deep waters. d E and d P refer to the isotopic composition of
evaporating vapor and precipitation, respectively. (From Craig and Gordon, 1965.)
564
K. K. Turekian, Yale University, New Haven,
CT, USA
Copyright & 2001 Elsevier Ltd.
The oxygen isotope signature of sea water varies as a
function of the processing of water in the oceanic
cycle. The two chemical parameters, salinity and
oxygen isotope ratio, are distinctive for various
water types. The oxygen-18 to oxygen-16 ratio is
represented in comparison to a standard. The notation is dO
18 which is defined as follows:
18 O=
16 O sample
18 O=
16 O standard
À 1
"
#
 1000
Figure 1 shows the results for the world oceans from
Craig and Gordon (1965). During the GEOSECS
program the oxygen isotope ratios of seawater
samples were also determined. The features resemble
those in Figure 1. The GEOSECS data are available
in the shore-based measurements volume of the
GEOSECS Atlas (1987) published by the US National Science Foundation.
The tracking of fresh water from streams draining
into the ocean at different latitudes has been used to
1.5
1.0
0.5
0
_ 0.5
_ 1.0
_ 1.5
33.0
33.5
34.0
34.5
35.0
35.5
36.0
36.5
37.0
37.5
38.0
Salinity (% )
Equatorial Surface Waters (Lusiad)
N. Atlantic Surface Waters (Zephyrus)
N. Atlantic Deep Water
Weddell Sea
(Eltanin Cruise 12)
d /d
(freezing)
S ≈ 0
Antarctic
Bottom
Water
Pacific and Indian
Deep Water
N. Atlantic
Deep Water
23S 12W
23N 8W
d /d = 0.11
= _ 4%
S
P
E =
27N 23W
20N 49W
21N 47W
25W 37W
=
_ 2 1 %
P
d
= 0 . 6 0
N . A t la n t ic
m ix in g
/ d S
34N 10W
12N 45W
0 11W
°
17N 55W
O (% )
18
Figure 1 Oxygen-18–salinity relationships in Atlantic surface and deep waters. d E and d P refer to the isotopic composition of
evaporating vapor and precipitation, respectively. (From Craig and Gordon, 1965.)
564