

with the lowest recorded value ( À 0.5%) of the
Cenozoic. Following this minimum at 52 Ma, d
18 O
values increased by 5.5%, recording maximum values (B5%) during the glacial intervals of Pleistocene
(Figure 6). The first part of this long-term change
was a gradual increase of 2% through the end of the
Eocene (52–34 Ma). The remainder of the increase
was accomplished through large steps at the Eocene/
Oligocene boundary (B33.5 Ma), during the middle
Miocene (ca. 15–13 Ma) and late Pliocene (ca. 3.2–
2.6 Ma). After 2.6 Ma, the amplitude of the
high-frequency signal increased to41%, reaching
1.8% over the past 800 thousand years.
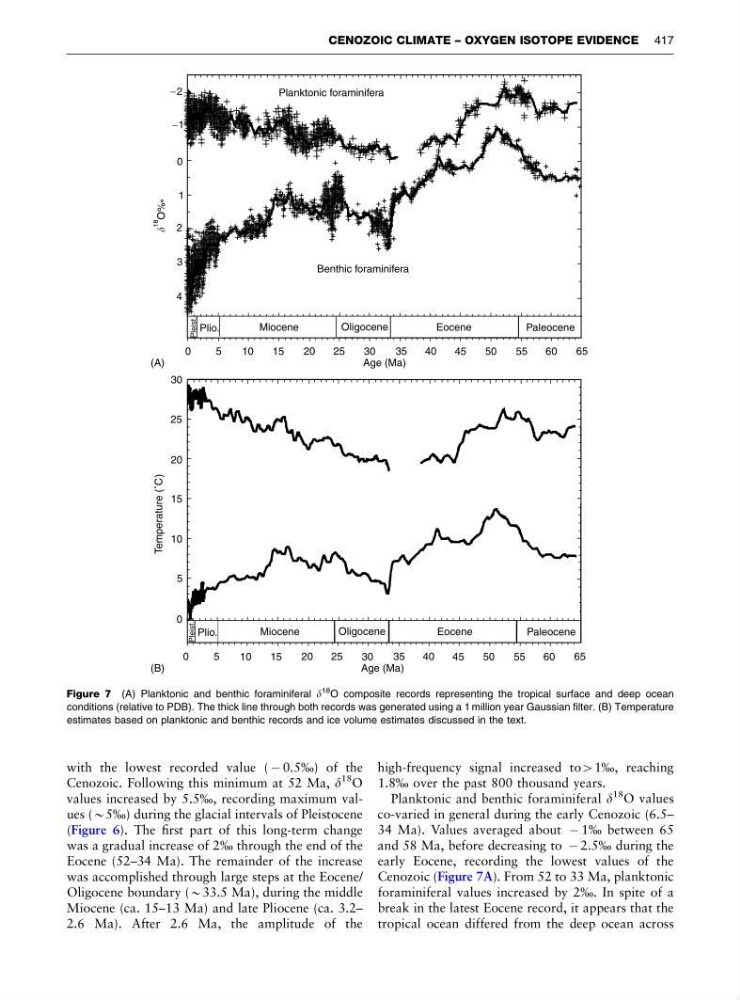
Planktonic and benthic foraminiferal d
18
O values
co-varied in general during the early Cenozoic (6.5–
34 Ma). Values averaged about À 1% between 65
and 58 Ma, before decreasing to À 2.5% during the
early Eocene, recording the lowest values of the
Cenozoic (Figure 7A). From 52 to 33 Ma, planktonic
foraminiferal values increased by 2%. In spite of a
break in the latest Eocene record, it appears that the
tropical ocean differed from the deep ocean across
_ 2
_ 1
0
1
2
3
4
0
5
10
15
20
25
30
35
40
45
50
55
60
65
Planktonic foraminifera
Benthic foraminifera
Plio.
Pleist.
Miocene
Oligocene
Eocene
Paleocene
18
O%
˚
Age (Ma)
0
5
10
15
20
25
30
35
40
45
50
55
60
65
Plio.
Pleist.
Miocene
Oligocene
Eocene
Paleocene
Age (Ma)
30
25
20
15
10
5
0
Temperature (˚C)
(A)
(B)
Figure 7 (A) Planktonic and benthic foraminiferal d
18 O composite records representing the tropical surface and deep ocean
conditions (relative to PDB). The thick line through both records was generated using a 1 million year Gaussian filter. (B) Temperature
estimates based on planktonic and benthic records and ice volume estimates discussed in the text.
CENOZOIC CLIMATE – OXYGEN ISOTOPE EVIDENCE 417
Cenozoic. Following this minimum at 52 Ma, d
18 O
values increased by 5.5%, recording maximum values (B5%) during the glacial intervals of Pleistocene
(Figure 6). The first part of this long-term change
was a gradual increase of 2% through the end of the
Eocene (52–34 Ma). The remainder of the increase
was accomplished through large steps at the Eocene/
Oligocene boundary (B33.5 Ma), during the middle
Miocene (ca. 15–13 Ma) and late Pliocene (ca. 3.2–
2.6 Ma). After 2.6 Ma, the amplitude of the
high-frequency signal increased to41%, reaching
1.8% over the past 800 thousand years.
Planktonic and benthic foraminiferal d
18
O values
co-varied in general during the early Cenozoic (6.5–
34 Ma). Values averaged about À 1% between 65
and 58 Ma, before decreasing to À 2.5% during the
early Eocene, recording the lowest values of the
Cenozoic (Figure 7A). From 52 to 33 Ma, planktonic
foraminiferal values increased by 2%. In spite of a
break in the latest Eocene record, it appears that the
tropical ocean differed from the deep ocean across
_ 2
_ 1
0
1
2
3
4
0
5
10
15
20
25
30
35
40
45
50
55
60
65
Planktonic foraminifera
Benthic foraminifera
Plio.
Pleist.
Miocene
Oligocene
Eocene
Paleocene
18
O%
˚
Age (Ma)
0
5
10
15
20
25
30
35
40
45
50
55
60
65
Plio.
Pleist.
Miocene
Oligocene
Eocene
Paleocene
Age (Ma)
30
25
20
15
10
5
0
Temperature (˚C)
(A)
(B)
Figure 7 (A) Planktonic and benthic foraminiferal d
18 O composite records representing the tropical surface and deep ocean
conditions (relative to PDB). The thick line through both records was generated using a 1 million year Gaussian filter. (B) Temperature
estimates based on planktonic and benthic records and ice volume estimates discussed in the text.
CENOZOIC CLIMATE – OXYGEN ISOTOPE EVIDENCE 417