

column global survey of the oceanic radiocarbon
distribution. The GEOSECS cruise tracks were approximately meridional through the center of the
major ocean basins. Radiocarbon was sampled with
a station spacing of approximately 500 km and an
average of 20 samples per station. All of the GEOSECS D
14 C measurements were made by G. O ¨ stlund
(University of Miami) and M. Stuiver (University of
Washington) using traditional b counting of largevolume water samples with a counting accuracy of
B4 ppt. GEOSECS results revolutionized what was
known about the oceanic D
14 C distribution and the
applications for which radiocarbon is used.
During the early 1980s the Atlantic Ocean was
again surveyed for radiocarbon as part of the Transient Tracers in the Ocean (TTO) North Atlantic
Study (NAS) and Tropical Atlantic Study (TAS)
programs and the South Atlantic Ventilation Experiment (SAVE). Sampling for these programs was
designed to enable mapping of property distributions
on constant pressure or density surfaces with reasonable gridding uncertainty. The radiocarbon
Atlantic
_ 200 _ 100
0
100
Indian
Pacific
Pressure (dB)
0
1000
2000
3000
4000
5000
6000
− 200 − 100
0
100
Southern
Δ
14 C (ppt)
0
1000
2000
3000
4000
5000
6000
Δ
14 C (ppt)
0
1000
2000
3000
4000
5000
6000
Pressure (dB)
0
1000
2000
3000
4000
5000
6000
− 200 − 100
0
100
Δ
14 C (ppt)
− 200 − 100
0
100
Δ
14 C (ppt)
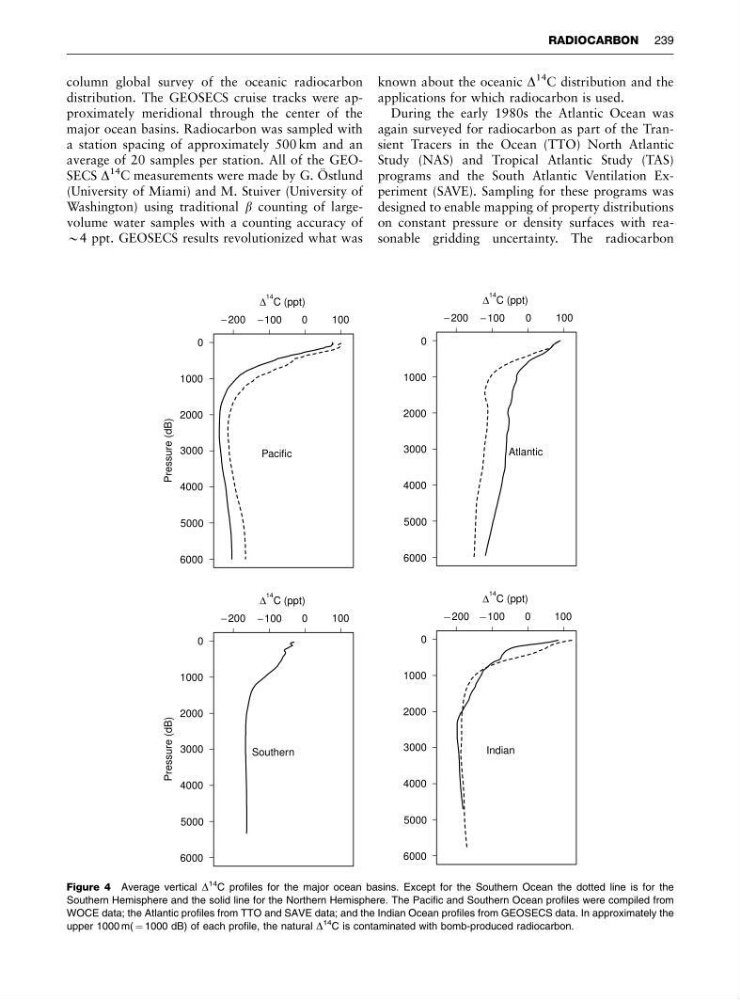
Figure 4 Average vertical D
14 C profiles for the major ocean basins. Except for the Southern Ocean the dotted line is for the
Southern Hemisphere and the solid line for the Northern Hemisphere. The Pacific and Southern Ocean profiles were compiled from
WOCE data; the Atlantic profiles from TTO and SAVE data; and the Indian Ocean profiles from GEOSECS data. In approximately the
upper 1000 m( ¼ 1000 dB) of each profile, the natural D
14 C is contaminated with bomb-produced radiocarbon.
RADIOCARBON 239
distribution. The GEOSECS cruise tracks were approximately meridional through the center of the
major ocean basins. Radiocarbon was sampled with
a station spacing of approximately 500 km and an
average of 20 samples per station. All of the GEOSECS D
14 C measurements were made by G. O ¨ stlund
(University of Miami) and M. Stuiver (University of
Washington) using traditional b counting of largevolume water samples with a counting accuracy of
B4 ppt. GEOSECS results revolutionized what was
known about the oceanic D
14 C distribution and the
applications for which radiocarbon is used.
During the early 1980s the Atlantic Ocean was
again surveyed for radiocarbon as part of the Transient Tracers in the Ocean (TTO) North Atlantic
Study (NAS) and Tropical Atlantic Study (TAS)
programs and the South Atlantic Ventilation Experiment (SAVE). Sampling for these programs was
designed to enable mapping of property distributions
on constant pressure or density surfaces with reasonable gridding uncertainty. The radiocarbon
Atlantic
_ 200 _ 100
0
100
Indian
Pacific
Pressure (dB)
0
1000
2000
3000
4000
5000
6000
− 200 − 100
0
100
Southern
Δ
14 C (ppt)
0
1000
2000
3000
4000
5000
6000
Δ
14 C (ppt)
0
1000
2000
3000
4000
5000
6000
Pressure (dB)
0
1000
2000
3000
4000
5000
6000
− 200 − 100
0
100
Δ
14 C (ppt)
− 200 − 100
0
100
Δ
14 C (ppt)
Figure 4 Average vertical D
14 C profiles for the major ocean basins. Except for the Southern Ocean the dotted line is for the
Southern Hemisphere and the solid line for the Northern Hemisphere. The Pacific and Southern Ocean profiles were compiled from
WOCE data; the Atlantic profiles from TTO and SAVE data; and the Indian Ocean profiles from GEOSECS data. In approximately the
upper 1000 m( ¼ 1000 dB) of each profile, the natural D
14 C is contaminated with bomb-produced radiocarbon.
RADIOCARBON 239