

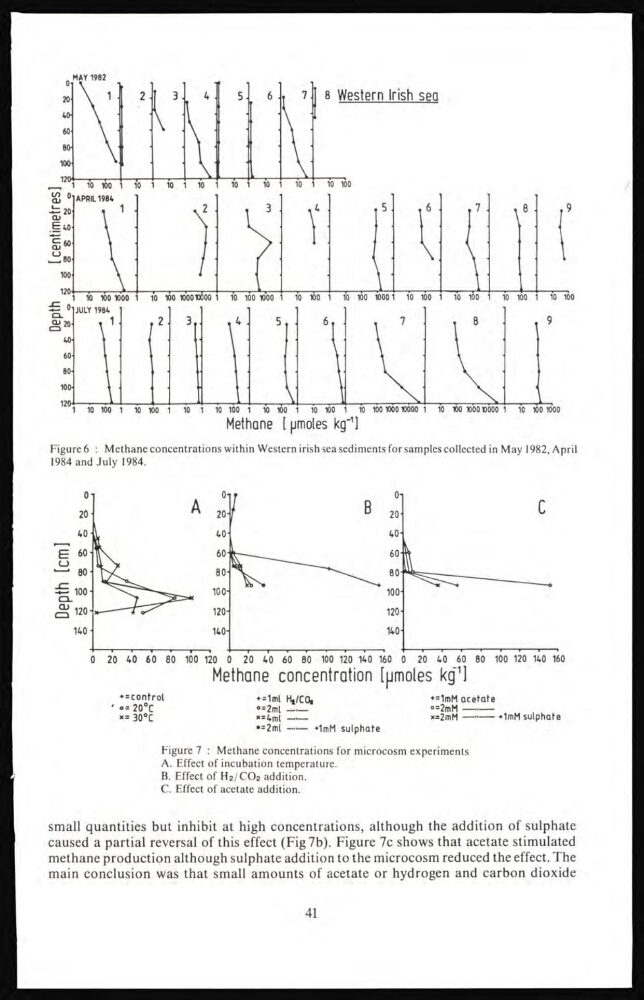
Figure 6 : Methane concentrations within Western irish sea sediments for samples collected in May 1982, April
1984 and July 1984.
0 20 40 60 60 100 120 0 20 40 60 60 100 120 140 160 0 20 40 60 80 100 120 140 160
Methane concentration [µmoles kg
1
]
+=control
+=1ml H2/CO2
+=1mM acetate
«20 C
°=2ml ——
°=2mM —''
x= 30°c
x=4ml
x=2mM —''
+1mM sulphate
«2ml —— +1mM sulphate
Figure 7 : Methane concentrations for microcosm experiments
A. Effect of incubation temperature.
B. Effect of H2/CO2 addition.
C. Effect of acetate addition.
small quantities but inhibit at high concentrations, although the addition of sulphate
caused a partial reversal of this effect (Fig 7b). Figure 7c shows that acetate stimulated
methane production although sulphate addition to the microcosm reduced the effect. The
main conclusion was that small amounts of acetate or hydrogen and carbon dioxide
41
1984 and July 1984.
0 20 40 60 60 100 120 0 20 40 60 60 100 120 140 160 0 20 40 60 80 100 120 140 160
Methane concentration [µmoles kg
1
]
+=control
+=1ml H2/CO2
+=1mM acetate
«20 C
°=2ml ——
°=2mM —''
x= 30°c
x=4ml
x=2mM —''
+1mM sulphate
«2ml —— +1mM sulphate
Figure 7 : Methane concentrations for microcosm experiments
A. Effect of incubation temperature.
B. Effect of H2/CO2 addition.
C. Effect of acetate addition.
small quantities but inhibit at high concentrations, although the addition of sulphate
caused a partial reversal of this effect (Fig 7b). Figure 7c shows that acetate stimulated
methane production although sulphate addition to the microcosm reduced the effect. The
main conclusion was that small amounts of acetate or hydrogen and carbon dioxide
41