

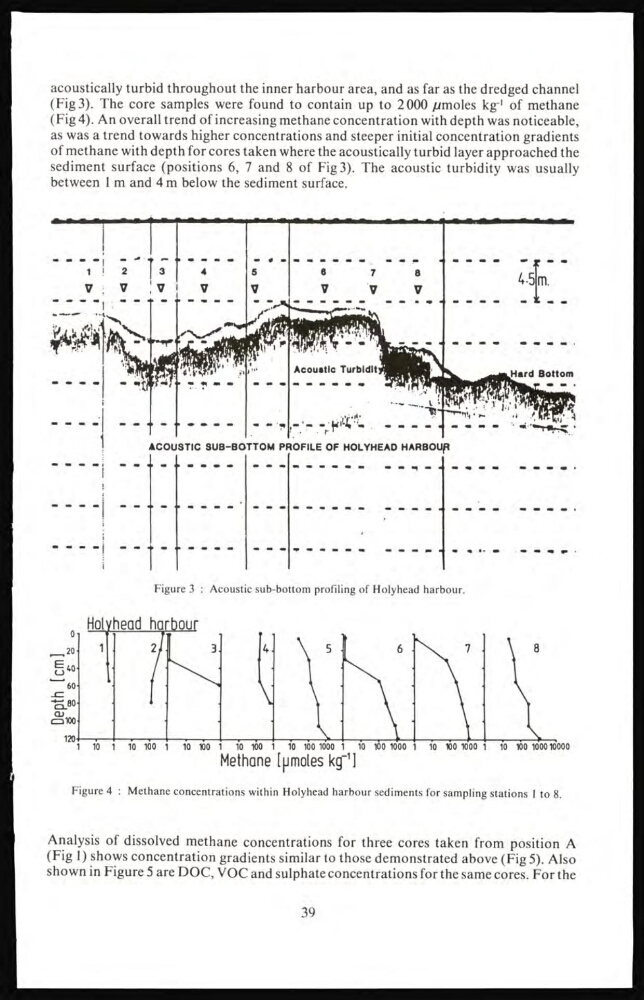
acoustically turbid throughout the inner harbour area, and as far as the dredged channel
(Fig 3). The core samples were found to contain up to 2000 µmoles kg -1 of methane
(Fig 4). An overall trend of increasing methane concentration with depth was noticeable,
as was a trend towards higher concentrations and steeper initial concentration gradients
of methane with depth for cores taken where the acoustically turbid layer approached the
sediment surface (positions 6, 7 and 8 of Fig 3). The acoustic turbidity was usually
between 1 m and 4 m below the sediment surface.
Figure 3 : Acoustic sub-bottom profiling of Holyhead harbour.
Figure 4 : Methane concentrations within Holyhead harbour sediments for sampling stations 1 to 8.
Analysis of dissolved methane concentrations for three cores taken from position A
(Fig 1) shows concentration gradients similar to those demonstrated above (Fig 5). Also
shown in Figure 5 are DOC, VOC and sulphate concentrations for the same cores. For the
39
(Fig 3). The core samples were found to contain up to 2000 µmoles kg -1 of methane
(Fig 4). An overall trend of increasing methane concentration with depth was noticeable,
as was a trend towards higher concentrations and steeper initial concentration gradients
of methane with depth for cores taken where the acoustically turbid layer approached the
sediment surface (positions 6, 7 and 8 of Fig 3). The acoustic turbidity was usually
between 1 m and 4 m below the sediment surface.
Figure 3 : Acoustic sub-bottom profiling of Holyhead harbour.
Figure 4 : Methane concentrations within Holyhead harbour sediments for sampling stations 1 to 8.
Analysis of dissolved methane concentrations for three cores taken from position A
(Fig 1) shows concentration gradients similar to those demonstrated above (Fig 5). Also
shown in Figure 5 are DOC, VOC and sulphate concentrations for the same cores. For the
39