

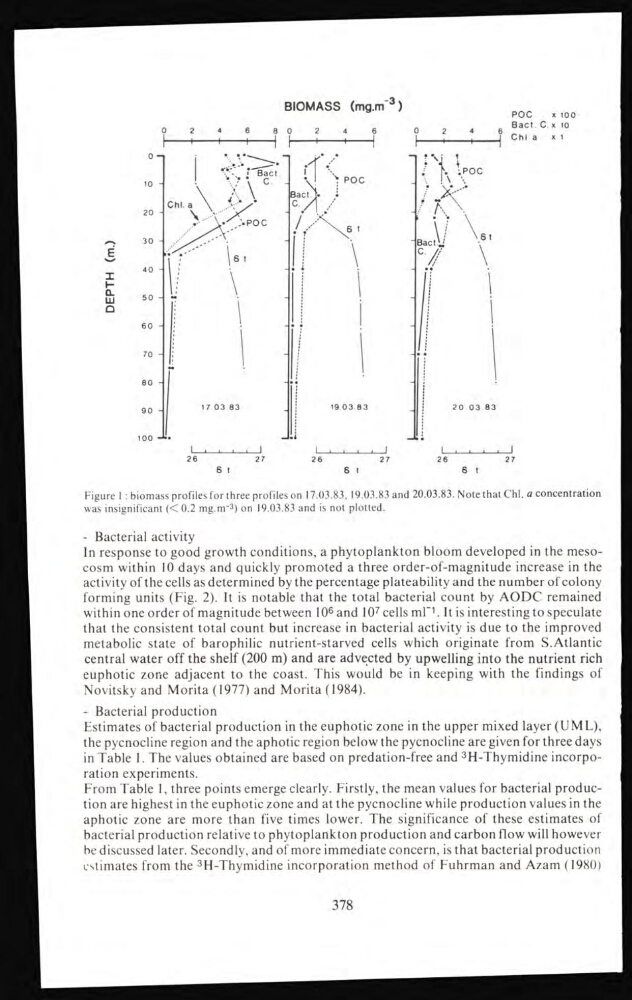
BIOMASS (mg.m -3 )
Figure 1 : biomass profiles for three profiles on 17.03.83, 19.03.83 and 20.03.83. Note that Chi. a concentration
was insignificant (< 0.2 mg.m -3 ) on 19.03.83 and is not plotted.
- Bacterial activity
In response to good growth conditions, a phytoplankton bloom developed in the mesocosm within 10 days and quickly promoted a three order-of-magnitude increase in the
activity of the cells as determined by the percentage plateability and the number of colony
forming units (Fig. 2). It is notable that the total bacterial count by AODC remained
within one order of magnitude between 10
6 and 10
7 cells mP. It is interesting to speculate
that the consistent total count but increase in bacterial activity is due to the improved
metabolic state of barophilic nutrient-starved cells which originate from S. Atlantic
central water off the shelf (200 m) and are advected by upwelling into the nutrient rich
euphotic zone adjacent to the coast. This would be in keeping with the findings of
Novitsky and Morita(1977) and Morita (1984).
- Bacterial production
Estimates of bacterial production in the euphotic zone in the upper mixed layer (UML),
the pycnocline region and the aphotic region below the pycnocline are given for three days
in Table 1. The values obtained are based on predation-free and 3 H-Thymidine incorporation experiments.
From Table 1, three points emerge clearly. Firstly, the mean values for bacterial production are highest in the euphotic zone and at the pycnocline while production values in the
aphotic zone are more than five times lower. The significance of these estimates of
bacterial production relative to phytoplankton production and carbon flow will however
be discussed later. Secondly, and of more immediate concern, is that bacterial production
estimates from the 3 H-Thymidine incorporation method of Fuhrman and Azam (1980)
378
Figure 1 : biomass profiles for three profiles on 17.03.83, 19.03.83 and 20.03.83. Note that Chi. a concentration
was insignificant (< 0.2 mg.m -3 ) on 19.03.83 and is not plotted.
- Bacterial activity
In response to good growth conditions, a phytoplankton bloom developed in the mesocosm within 10 days and quickly promoted a three order-of-magnitude increase in the
activity of the cells as determined by the percentage plateability and the number of colony
forming units (Fig. 2). It is notable that the total bacterial count by AODC remained
within one order of magnitude between 10
6 and 10
7 cells mP. It is interesting to speculate
that the consistent total count but increase in bacterial activity is due to the improved
metabolic state of barophilic nutrient-starved cells which originate from S. Atlantic
central water off the shelf (200 m) and are advected by upwelling into the nutrient rich
euphotic zone adjacent to the coast. This would be in keeping with the findings of
Novitsky and Morita(1977) and Morita (1984).
- Bacterial production
Estimates of bacterial production in the euphotic zone in the upper mixed layer (UML),
the pycnocline region and the aphotic region below the pycnocline are given for three days
in Table 1. The values obtained are based on predation-free and 3 H-Thymidine incorporation experiments.
From Table 1, three points emerge clearly. Firstly, the mean values for bacterial production are highest in the euphotic zone and at the pycnocline while production values in the
aphotic zone are more than five times lower. The significance of these estimates of
bacterial production relative to phytoplankton production and carbon flow will however
be discussed later. Secondly, and of more immediate concern, is that bacterial production
estimates from the 3 H-Thymidine incorporation method of Fuhrman and Azam (1980)
378