

1.5 and 3 litres of water samples were filtered through 0.45 ,um pore-size
acid-cleaned filters. The determination of inorganic mercury (Hg(II))
anel methyl-Hg (MMHg) in the dissolved phase and suspended particles
or sediments has been performed by hydride generation or ethylation,
ctyogenic trapping, gas chromatography and detection by atomic absorption or fluorescence spectrometry. All analytical methods are described in detail elsewhere (Tseng et al., 1998; Tseng, 2000).
Results and discussion
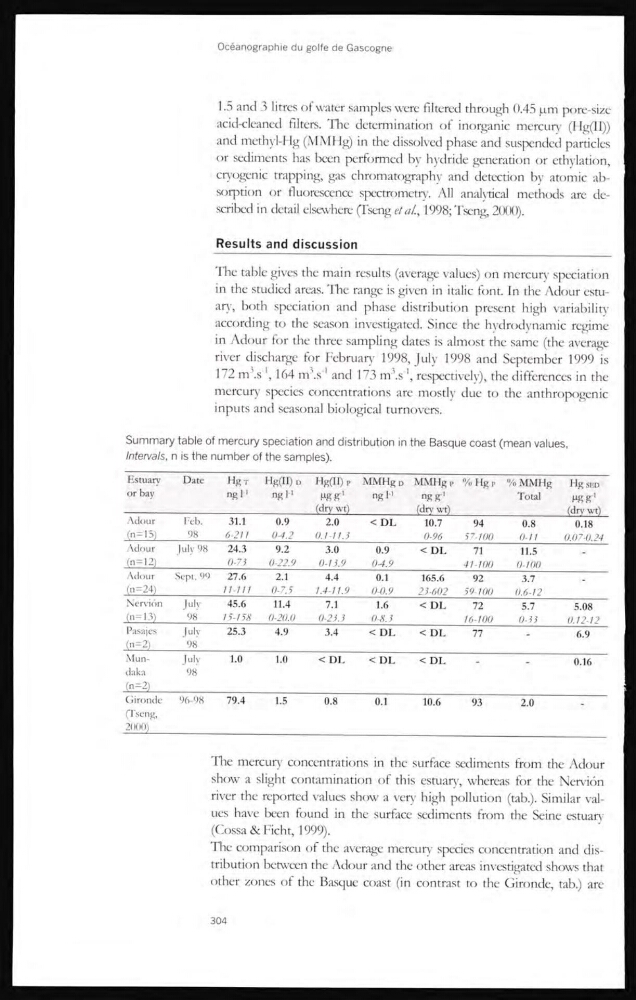
The table gives the main results (average values) on mercury speciation
in the studied areas. The range is given in italic font. In the Adour esmary, both speciation and phase distribution present high variability
according to the season investigated. Since the hydrodynamic regime
in Adour for the three sampling dates is almost the same (the average
river discharge for February 1998, July 1998 and September 1999 is
1 72 m’.s
-1 , 164 m
3 .s
-1 and 173 m
3 .s
-1 , respectively), the differences in the
mercury species concentrations are mostly due to the anthropogenic
inputs and seasonal biological turnovers.
Summary table of mercury speciation and distribution in the Basque coast (mean values,
Intervals, n is the number of the samples).
Estuary
or bay
Date
Hg r
ng l '
Hg(H) D
ngl'
Hg(II) P
Wg 1
(drv wt)
MMHg D
ngl'
MMHg P
nggr'
(dn' wt)
% Hg P % MMHg
Total
Hg SED
Ogg'
(dm \vt)
Adour
1 C'I).
31.1
0.9
2.0
< DL
10.7
94
0.8
0.18
(n=lS)
03
6-211
0-4.2
0.1-11. t
0-96
57-100
0-11
0.07-0.24
Adour
July 08
24.3
9.2
3.0
0.9
< DL
71
11.5
_
(n-12)
0-73
0-22. v
0-1 i.o
04.9
41-100
0-100
Adour
Scpt. 99
27.6
2.1
4.4
0.1
165.6
92
3.7
_
(n=24)
//-///
0-7.5
1.4-11.9
0-02>
21-602
59-/00
0.6-12
Nervion
Julv
45.6
11.4
7.1
1.6
< DL
72
5.7
5.08
(n='A
98
/ y / 58
0-20.0
0-2 i. >
0-8. S
16-100
0- >' >
0.12-12
Pasajes
|ulv
25.3
4.9
3.4
< DL
< DL
77
_
6.9
(n=2)
98
MunI uly
1.0
1.0
< DL
< DL
< DL
_
_
0.16
daka
98
(n=2)
Gironde
(Tseng,
2000)
96-98
79.4
1.5
0.8
0.1
10.6
93
2.0
The mcrcury concentrations in the surface sediments from the Adour
show a slight contamination of this estuary, whereas for the Nervion
river the reported values show a vem high pollution (tab.). Similar valucs have been found in the surface sediments from the Seine estuan'
(Cossa & Ficht, 1999).
The comparison of the average mercury species concentration and distribution between the Adour and the other areas investigated shows that
other zones of the Basque coast (in contrast to the Gironde, tab.) are
304
acid-cleaned filters. The determination of inorganic mercury (Hg(II))
anel methyl-Hg (MMHg) in the dissolved phase and suspended particles
or sediments has been performed by hydride generation or ethylation,
ctyogenic trapping, gas chromatography and detection by atomic absorption or fluorescence spectrometry. All analytical methods are described in detail elsewhere (Tseng et al., 1998; Tseng, 2000).
Results and discussion
The table gives the main results (average values) on mercury speciation
in the studied areas. The range is given in italic font. In the Adour esmary, both speciation and phase distribution present high variability
according to the season investigated. Since the hydrodynamic regime
in Adour for the three sampling dates is almost the same (the average
river discharge for February 1998, July 1998 and September 1999 is
1 72 m’.s
-1 , 164 m
3 .s
-1 and 173 m
3 .s
-1 , respectively), the differences in the
mercury species concentrations are mostly due to the anthropogenic
inputs and seasonal biological turnovers.
Summary table of mercury speciation and distribution in the Basque coast (mean values,
Intervals, n is the number of the samples).
Estuary
or bay
Date
Hg r
ng l '
Hg(H) D
ngl'
Hg(II) P
Wg 1
(drv wt)
MMHg D
ngl'
MMHg P
nggr'
(dn' wt)
% Hg P % MMHg
Total
Hg SED
Ogg'
(dm \vt)
Adour
1 C'I).
31.1
0.9
2.0
< DL
10.7
94
0.8
0.18
(n=lS)
03
6-211
0-4.2
0.1-11. t
0-96
57-100
0-11
0.07-0.24
Adour
July 08
24.3
9.2
3.0
0.9
< DL
71
11.5
_
(n-12)
0-73
0-22. v
0-1 i.o
04.9
41-100
0-100
Adour
Scpt. 99
27.6
2.1
4.4
0.1
165.6
92
3.7
_
(n=24)
//-///
0-7.5
1.4-11.9
0-02>
21-602
59-/00
0.6-12
Nervion
Julv
45.6
11.4
7.1
1.6
< DL
72
5.7
5.08
(n='A
98
/ y / 58
0-20.0
0-2 i. >
0-8. S
16-100
0- >' >
0.12-12
Pasajes
|ulv
25.3
4.9
3.4
< DL
< DL
77
_
6.9
(n=2)
98
MunI uly
1.0
1.0
< DL
< DL
< DL
_
_
0.16
daka
98
(n=2)
Gironde
(Tseng,
2000)
96-98
79.4
1.5
0.8
0.1
10.6
93
2.0
The mcrcury concentrations in the surface sediments from the Adour
show a slight contamination of this estuary, whereas for the Nervion
river the reported values show a vem high pollution (tab.). Similar valucs have been found in the surface sediments from the Seine estuan'
(Cossa & Ficht, 1999).
The comparison of the average mercury species concentration and distribution between the Adour and the other areas investigated shows that
other zones of the Basque coast (in contrast to the Gironde, tab.) are
304