

variations of the river discharge have been attenuated, being the
maximum discharge of 9 m
3 .s
1 in winter and 2 m
3 .s
1 in summer under
present conditions.
Material and methods
The MOHID 3D, which is a primitive equation model based in the
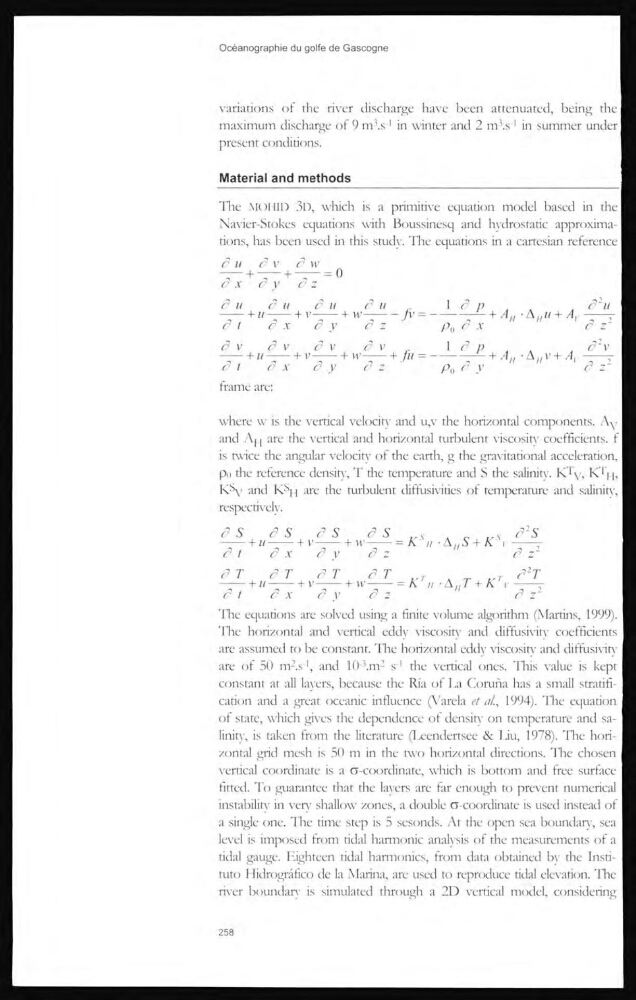
Navier-Stokes equations with Boussinesq and hydrostatic approximations, has been used in this study. The equarions in a cartesian reference
frame are:
where w is the vertical velocity and u,v the horizontal components. Ay
and Aj { are the vertical and horizontal turbulent viscosity coefficients. f
is twice the angular velocity of the eatth, g the gravitarional acceleration,
po the reference density, T the temperature and S ffie salinity. K
T
v> K
T
H,
K S
v - and K s
h are the turbulent diffusivities of temperature and salinity,
respecrively.
The equarictns are solved using a finite volume algorithm (Martins, 1999).
The horizontal and vertical eddy viscositv and diffusivity coefficients
are assumed to be constant. The horizontal eddv viscosity and diffusivitv
are of 50 m
2 .s
3 , and 10Am
2 s
3 the vertical ones. This value is kept
constant at all layers, because the Ria of La Comria has a small strarification and a great oceanic influence (A'arela et al., 1994). The equation
of state, which gives the dependence of density on temperature and salinity, is taken from the literature (Leendertsee & Liu, 1978). The horizontal grid mesh is 50 m in the two horizontal directions. The chosen
vertical coordinate is a a-coordinate, which is bottom and free surface
fitted. To guarantee that the lavers are htr enough to prevent numerical
instability in very shallow zones, a double G-coordinate ts used instead of
a single one. The time step is 5 sesonds. At the (tpen sea boundary, sea
level is imposed from ridal harmonic analvsis of the measurements of a
tidal gauge. Eighteen tidal harmonics, from data obtained by the Instimto Hidrogrâfico de la Marina, are used to reproduce ridal elevation. The
river boundart’ is simulated through a 2D vertical model, considering
258
maximum discharge of 9 m
3 .s
1 in winter and 2 m
3 .s
1 in summer under
present conditions.
Material and methods
The MOHID 3D, which is a primitive equation model based in the
Navier-Stokes equations with Boussinesq and hydrostatic approximations, has been used in this study. The equarions in a cartesian reference
frame are:
where w is the vertical velocity and u,v the horizontal components. Ay
and Aj { are the vertical and horizontal turbulent viscosity coefficients. f
is twice the angular velocity of the eatth, g the gravitarional acceleration,
po the reference density, T the temperature and S ffie salinity. K
T
v> K
T
H,
K S
v - and K s
h are the turbulent diffusivities of temperature and salinity,
respecrively.
The equarictns are solved using a finite volume algorithm (Martins, 1999).
The horizontal and vertical eddy viscositv and diffusivity coefficients
are assumed to be constant. The horizontal eddv viscosity and diffusivitv
are of 50 m
2 .s
3 , and 10Am
2 s
3 the vertical ones. This value is kept
constant at all layers, because the Ria of La Comria has a small strarification and a great oceanic influence (A'arela et al., 1994). The equation
of state, which gives the dependence of density on temperature and salinity, is taken from the literature (Leendertsee & Liu, 1978). The horizontal grid mesh is 50 m in the two horizontal directions. The chosen
vertical coordinate is a a-coordinate, which is bottom and free surface
fitted. To guarantee that the lavers are htr enough to prevent numerical
instability in very shallow zones, a double G-coordinate ts used instead of
a single one. The time step is 5 sesonds. At the (tpen sea boundary, sea
level is imposed from ridal harmonic analvsis of the measurements of a
tidal gauge. Eighteen tidal harmonics, from data obtained by the Instimto Hidrogrâfico de la Marina, are used to reproduce ridal elevation. The
river boundart’ is simulated through a 2D vertical model, considering
258