

The wave parameters have been recorded at the TOSCA station indicating a
mean significant wave height H
s
of 1.3 m and a mean zero-crossing period T, of 6.3 seconds. Figure 2 shows the significant wave height H
s
,
wave period T
z
and mean water depth obtained during the 92 hours deployment. Wave characteristics, derived from the pressure sensor records
after correction of the depth attenuation, exhibit a modulation of wave
height with tidal elevation. This pattern can be attributed to changes in
the wave refraction over the complex bathymetry of the area, during
different mean water depths throughout the tidal cycle. The measurements suggest a swell coming from the N-NW direction (335°N). The
variations of the salinity follow the semi-diumal ct'de showing mean
values between 21.5"4, and 27%.,. Density and salinity profiles have also
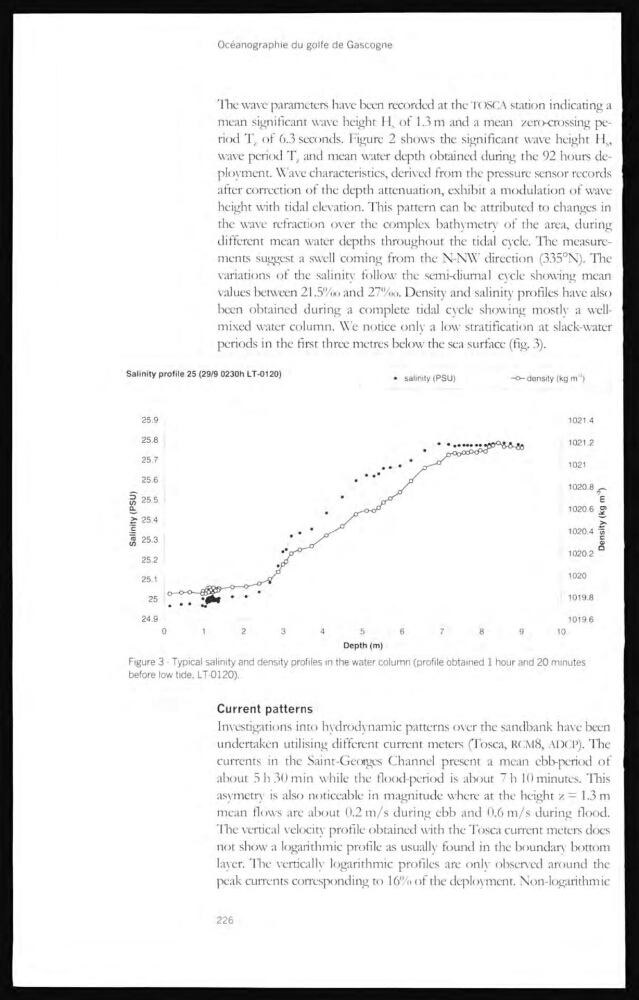
been obtained during a complete tidal cycle showing mosdy a wellmixed water column. We notice only a low stratification at slack-water
periods in the ftrst three metres below the sea surface (fig. 3).
Figure 3 ■ Typical salinity and density profiles in the water column (profile obtained 1 hour and 20 minutes
before low tide, LT-0120).
Current patterns
Investigations into hydrodynamic patterns over the sandbank have been
undertaken utilising different current meters (Tosca, RCM8, ADCP). Tlie
currents in the Saint-Geotjtys Channel present a mean ebb-period of
about 5 h 30 min while the flood-period is about 7 h 10 minutes. This
asvmetry is also noticeable in magnitude where at the height /. = 1.3 m
mean flows are about 0.2 m/s during ebb and 0.6 m/s during flood.
The vertical velocity profile obtained with the Tosca current meters does
not show a logarithmic profile as usually found in the boundary bottom
layer. The verticaily logarithmic profiles are only obsen-ed around the
peak currents corresponding to 16°/o of the deployment. Non-logarithmic
226
mean significant wave height H
s
of 1.3 m and a mean zero-crossing period T, of 6.3 seconds. Figure 2 shows the significant wave height H
s
,
wave period T
z
and mean water depth obtained during the 92 hours deployment. Wave characteristics, derived from the pressure sensor records
after correction of the depth attenuation, exhibit a modulation of wave
height with tidal elevation. This pattern can be attributed to changes in
the wave refraction over the complex bathymetry of the area, during
different mean water depths throughout the tidal cycle. The measurements suggest a swell coming from the N-NW direction (335°N). The
variations of the salinity follow the semi-diumal ct'de showing mean
values between 21.5"4, and 27%.,. Density and salinity profiles have also
been obtained during a complete tidal cycle showing mosdy a wellmixed water column. We notice only a low stratification at slack-water
periods in the ftrst three metres below the sea surface (fig. 3).
Figure 3 ■ Typical salinity and density profiles in the water column (profile obtained 1 hour and 20 minutes
before low tide, LT-0120).
Current patterns
Investigations into hydrodynamic patterns over the sandbank have been
undertaken utilising different current meters (Tosca, RCM8, ADCP). Tlie
currents in the Saint-Geotjtys Channel present a mean ebb-period of
about 5 h 30 min while the flood-period is about 7 h 10 minutes. This
asvmetry is also noticeable in magnitude where at the height /. = 1.3 m
mean flows are about 0.2 m/s during ebb and 0.6 m/s during flood.
The vertical velocity profile obtained with the Tosca current meters does
not show a logarithmic profile as usually found in the boundary bottom
layer. The verticaily logarithmic profiles are only obsen-ed around the
peak currents corresponding to 16°/o of the deployment. Non-logarithmic
226