

per cubic metre. This spring bloom starts generally during March, when
the light attenuation caused by terrigenous suspended matter decreases,
and reaches its maximum around April-May.
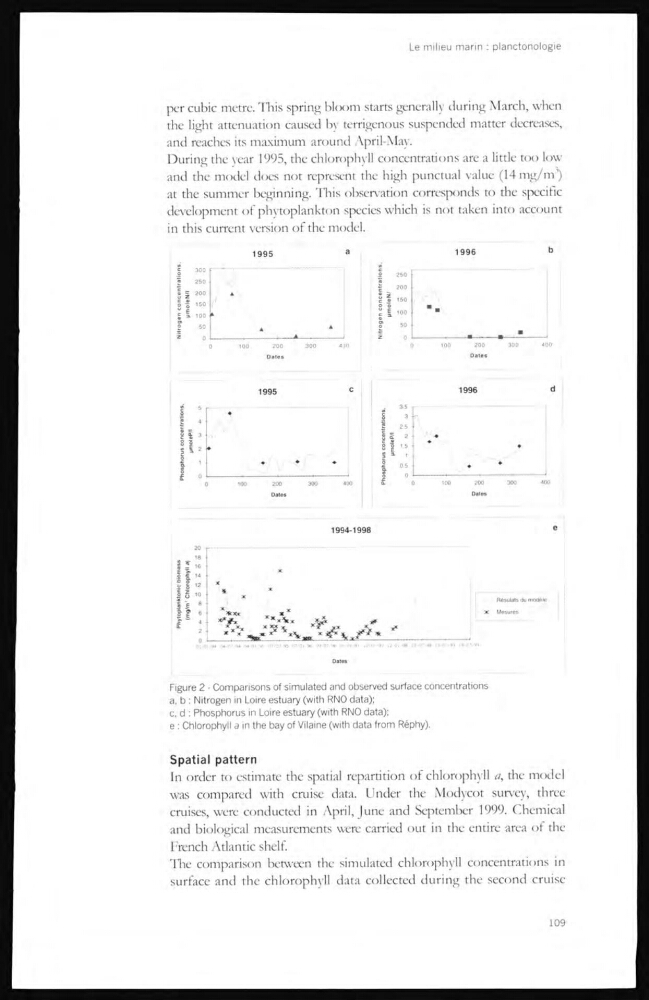
During the year 1995, the chlorophyll concentrations are a little too low
and the model does not represent the high punctual value (14mg/m 3 )
at the summer beginning. This observation corresponds to the specific
development of phytoplankton species which is not taken into account
in this current version of the model.
Figure 2 - Comparisons of simulated and observed surface concentrations
a, b : Nitrogen in Loire estuary (with RNO data);
c, d : Phosphorus in Loire estuary (with RNO data);
e : Chlorophyll a in the bay of Vilaine (with data from Réphy).
Spatial pattern
In order to estimate the spatial repartition of chlorophyll a, the model
was compared with cmise data. Under the Modycot survey, three
cmises, were conducted in April, June and September 1999. Chemical
and biological measurements were carried out in the entire area of the
French Adantic shelf.
The comparisttn between the simulated chlorophyll concentrations in
surface and the chlorophyll data collected during the second cruise
109
the light attenuation caused by terrigenous suspended matter decreases,
and reaches its maximum around April-May.
During the year 1995, the chlorophyll concentrations are a little too low
and the model does not represent the high punctual value (14mg/m 3 )
at the summer beginning. This observation corresponds to the specific
development of phytoplankton species which is not taken into account
in this current version of the model.
Figure 2 - Comparisons of simulated and observed surface concentrations
a, b : Nitrogen in Loire estuary (with RNO data);
c, d : Phosphorus in Loire estuary (with RNO data);
e : Chlorophyll a in the bay of Vilaine (with data from Réphy).
Spatial pattern
In order to estimate the spatial repartition of chlorophyll a, the model
was compared with cmise data. Under the Modycot survey, three
cmises, were conducted in April, June and September 1999. Chemical
and biological measurements were carried out in the entire area of the
French Adantic shelf.
The comparisttn between the simulated chlorophyll concentrations in
surface and the chlorophyll data collected during the second cruise
109