

Regulatory aspects
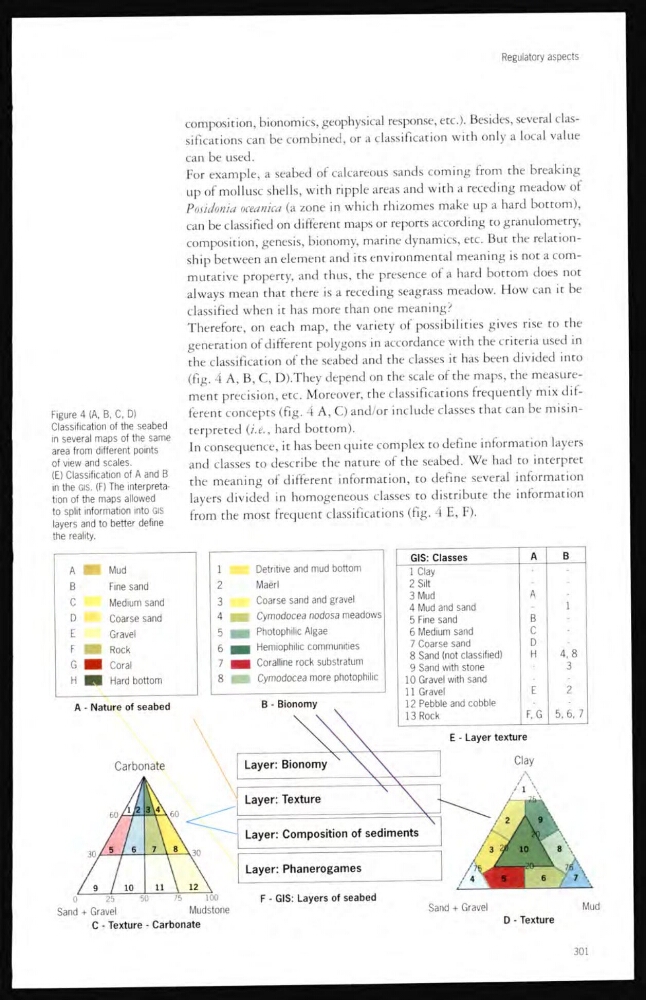
Figure 4 (A, B, C, D)
Classification of the seabed
in several maps of the same
area from different points
of view and scales.
(E) Classification of A and B
in the GIS. (F) The interpretation of the maps allowed
to split information into GIS
layers and to better define
the reality.
composition, bionomics, geophysical response, etc.). Besides, several classificacions can be combined, or a classification with only a local value
can be used.
For example, a seabed of calcareous sands coming from the breaking
up of mollusc shells, with ripple areas and with a receding meadow of
Posidonia oceanica (a zone in which rhizomes make up a hard bottom),
can be classified on different maps or reports according to granulometry,
composition, genesis, bionomy, marine dynamics, etc. But the relationship between an element and its environmental meaning is not a commutative property, and thus, the presence of a hard bottom does not
always mean that there is a receding seagrass meadow. How can it be
classified when it has more than one meaning?
Therefore, on each map, the variety of possibilities gives rise to the
generation of different polygons in accordance with the criteria used in
the classification of the seabed and the classes it has been divided into
(fig. 4 A, B, C, D).They depend on the scale of the maps, the measurement precision, etc. Moreover, rhe classifications frequently mix different concepts (fig. 4 A, C) and/or include classes that can be misinterpreted (i.e, hard bottom).
In consequence, it has been quite complex to define information layers
and classes to describe the nature of the seabed. We had to interpret
the meaning of different information, to define several information
layers divided in homogeneous classes to distnbute the information
from the most frequent classifications (fig. 4 E, F).
301
Figure 4 (A, B, C, D)
Classification of the seabed
in several maps of the same
area from different points
of view and scales.
(E) Classification of A and B
in the GIS. (F) The interpretation of the maps allowed
to split information into GIS
layers and to better define
the reality.
composition, bionomics, geophysical response, etc.). Besides, several classificacions can be combined, or a classification with only a local value
can be used.
For example, a seabed of calcareous sands coming from the breaking
up of mollusc shells, with ripple areas and with a receding meadow of
Posidonia oceanica (a zone in which rhizomes make up a hard bottom),
can be classified on different maps or reports according to granulometry,
composition, genesis, bionomy, marine dynamics, etc. But the relationship between an element and its environmental meaning is not a commutative property, and thus, the presence of a hard bottom does not
always mean that there is a receding seagrass meadow. How can it be
classified when it has more than one meaning?
Therefore, on each map, the variety of possibilities gives rise to the
generation of different polygons in accordance with the criteria used in
the classification of the seabed and the classes it has been divided into
(fig. 4 A, B, C, D).They depend on the scale of the maps, the measurement precision, etc. Moreover, rhe classifications frequently mix different concepts (fig. 4 A, C) and/or include classes that can be misinterpreted (i.e, hard bottom).
In consequence, it has been quite complex to define information layers
and classes to describe the nature of the seabed. We had to interpret
the meaning of different information, to define several information
layers divided in homogeneous classes to distnbute the information
from the most frequent classifications (fig. 4 E, F).
301