

Environmental and resource applications
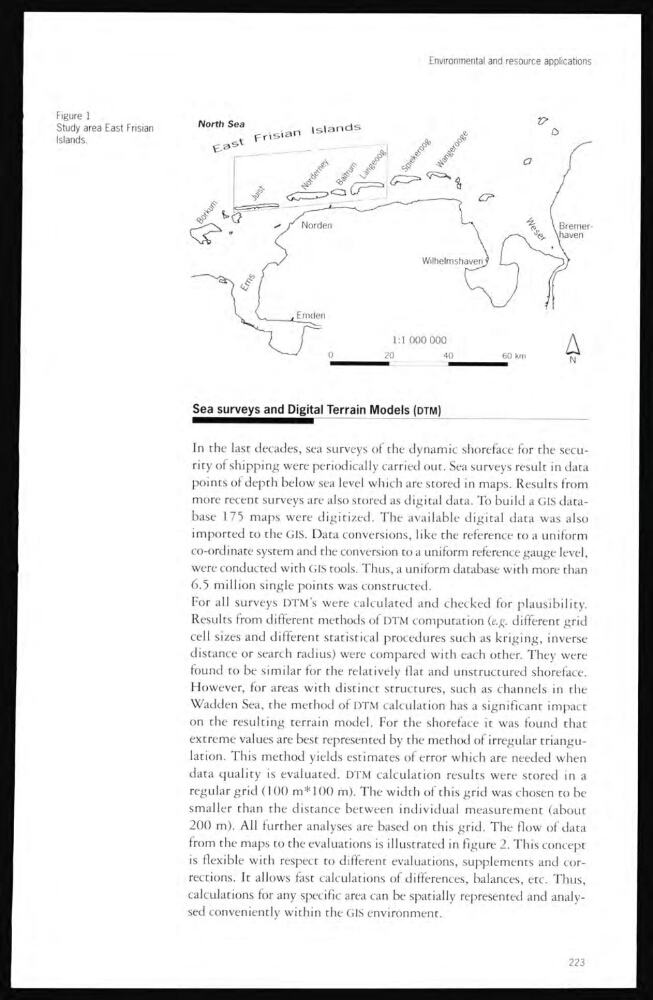
Figure 1
Study area East Frisian
Islands.
Sea surveys and Digital Terrain Models (DTM)
In the last decades, sea surveys of the dynamic shoreface for the security of shipping were periodically carried out. Sea surveys result in data
points of depth below sea level which are stored in maps. Results from
more recent surveys are also stored as digital data. To build a GIS database 175 maps were digitized. The available digital data was also
imported to the GIS. Data conversions, like the reference to a uniform
co-ordinate system and the conversion to a uniform reference gauge level,
were conducted with GIS tools. Thus, a uniform database with more than
6.5 million single points was constructed.
For all surveys DTM’s were calculated and checked for plausibility.
Results from different methods of DTM computation (e.g. different grid
cell sizes and different statistical procedures such as kriging, inverse
distance or search radius) were compared with each other. They were
found to be similar for the relatively flat and unstructured shoreface.
However, for areas with distinct structures, such as channels in the
Wadden Sea, the method of DTM calculation has a significant impact
on the resulting terrain model. For the shoreface it was found that
extreme values are best represented by the method of irregular triangulation. This method yields estimates of error which are needed when
data quality is evaluated. DTM calculation results were stored in a
regular grid (100 m*100 m). The width of this grid was chosen to be
smaller than the distance between individual measurement (about
200 m). All further analyses are based on this grid. The flow of data
from the maps to the evaluations is illustrated in figure 2. This concept
is flexible with respect to different evaluations, supplements and corrections. It allows fast calculations of differences, balances, etc. Thus,
calculations for any specific area can be spatially represented and analysed conveniently within the GIS environment.
223
Figure 1
Study area East Frisian
Islands.
Sea surveys and Digital Terrain Models (DTM)
In the last decades, sea surveys of the dynamic shoreface for the security of shipping were periodically carried out. Sea surveys result in data
points of depth below sea level which are stored in maps. Results from
more recent surveys are also stored as digital data. To build a GIS database 175 maps were digitized. The available digital data was also
imported to the GIS. Data conversions, like the reference to a uniform
co-ordinate system and the conversion to a uniform reference gauge level,
were conducted with GIS tools. Thus, a uniform database with more than
6.5 million single points was constructed.
For all surveys DTM’s were calculated and checked for plausibility.
Results from different methods of DTM computation (e.g. different grid
cell sizes and different statistical procedures such as kriging, inverse
distance or search radius) were compared with each other. They were
found to be similar for the relatively flat and unstructured shoreface.
However, for areas with distinct structures, such as channels in the
Wadden Sea, the method of DTM calculation has a significant impact
on the resulting terrain model. For the shoreface it was found that
extreme values are best represented by the method of irregular triangulation. This method yields estimates of error which are needed when
data quality is evaluated. DTM calculation results were stored in a
regular grid (100 m*100 m). The width of this grid was chosen to be
smaller than the distance between individual measurement (about
200 m). All further analyses are based on this grid. The flow of data
from the maps to the evaluations is illustrated in figure 2. This concept
is flexible with respect to different evaluations, supplements and corrections. It allows fast calculations of differences, balances, etc. Thus,
calculations for any specific area can be spatially represented and analysed conveniently within the GIS environment.
223