

552
M. V. L. BENNETT
I
Threshold
10
2 3 4 5 6 7 8 91011 121314
cm
F E O C B A
F E D C B A
cm
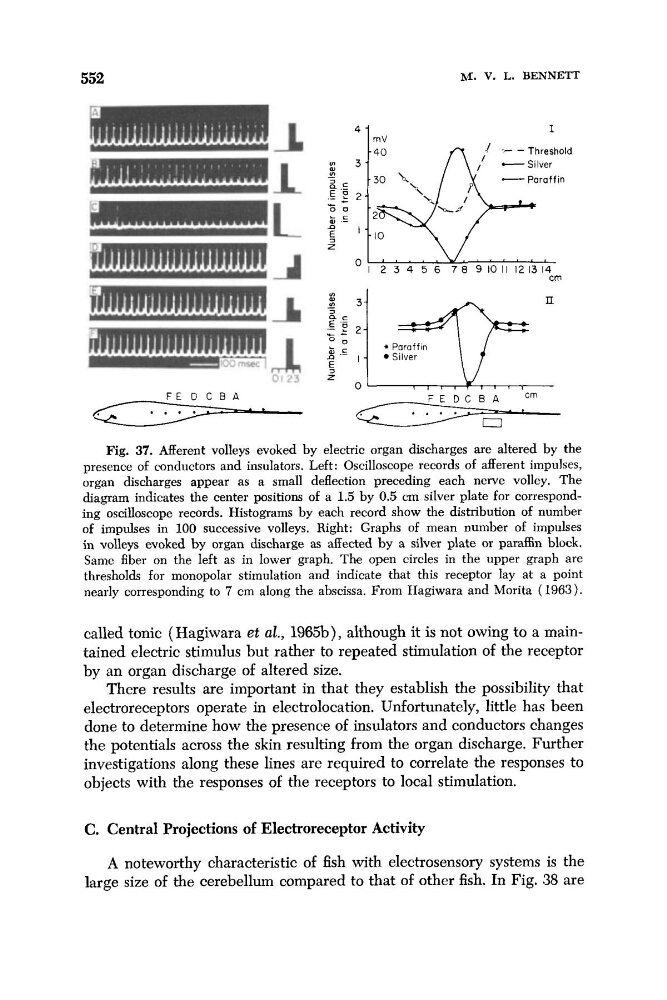
Fig. 37. Afferent volleys evoked by electric organ discharges are altered by the
presence of conductors and insulators. Left: Oscilloscope records of afferent impulses,
organ discharges appear as a small deflection preceding each nerve volley. The
diagram indicates the center positions of a 1.5 by 0.5 cm silver plate for corresponding oscilloscope records. Histograms by each record show the distribution of number
of impulses in 100 successive volleys. Right: Graphs of mean number of impulses
in volleys evoked by organ discharge as affected by a silver plate or paraffin block.
Same fiber on the left as in lower graph. The open circles in the upper graph are
thresholds for monopolar stimulation and indicate that this receptor lay at a point
nearly corresponding to 7 cm along the abscissa. From Hagiwara and Morita ( 1963).
called tonic (Hagiwara et al., 1965b), although it is not owing to a maintained electric stimulus but rather to repeated stimulation of the receptor
by an organ discharge of altered size.
There results are important in that they establish the possibility that
electroreceptors operate in electrolocation. Unfortunately, little has been
done to determine how the presence of insulators and conductors changes
the potentials across the skin resulting from the organ discharge. Further
investigations along these lines are required to correlate the responses to
objects with the responses of the receptors to local stimulation.
C. Central Projections of Electroreceptor Activity
A noteworthy characteristic of fish with electrosensory systems is the
large size of the cerebellum compared to that of other fish. In Fig. 38 are
M. V. L. BENNETT
I
Threshold
10
2 3 4 5 6 7 8 91011 121314
cm
F E O C B A
F E D C B A
cm
Fig. 37. Afferent volleys evoked by electric organ discharges are altered by the
presence of conductors and insulators. Left: Oscilloscope records of afferent impulses,
organ discharges appear as a small deflection preceding each nerve volley. The
diagram indicates the center positions of a 1.5 by 0.5 cm silver plate for corresponding oscilloscope records. Histograms by each record show the distribution of number
of impulses in 100 successive volleys. Right: Graphs of mean number of impulses
in volleys evoked by organ discharge as affected by a silver plate or paraffin block.
Same fiber on the left as in lower graph. The open circles in the upper graph are
thresholds for monopolar stimulation and indicate that this receptor lay at a point
nearly corresponding to 7 cm along the abscissa. From Hagiwara and Morita ( 1963).
called tonic (Hagiwara et al., 1965b), although it is not owing to a maintained electric stimulus but rather to repeated stimulation of the receptor
by an organ discharge of altered size.
There results are important in that they establish the possibility that
electroreceptors operate in electrolocation. Unfortunately, little has been
done to determine how the presence of insulators and conductors changes
the potentials across the skin resulting from the organ discharge. Further
investigations along these lines are required to correlate the responses to
objects with the responses of the receptors to local stimulation.
C. Central Projections of Electroreceptor Activity
A noteworthy characteristic of fish with electrosensory systems is the
large size of the cerebellum compared to that of other fish. In Fig. 38 are