

36
b
T. TOMITA
0.2 rnV
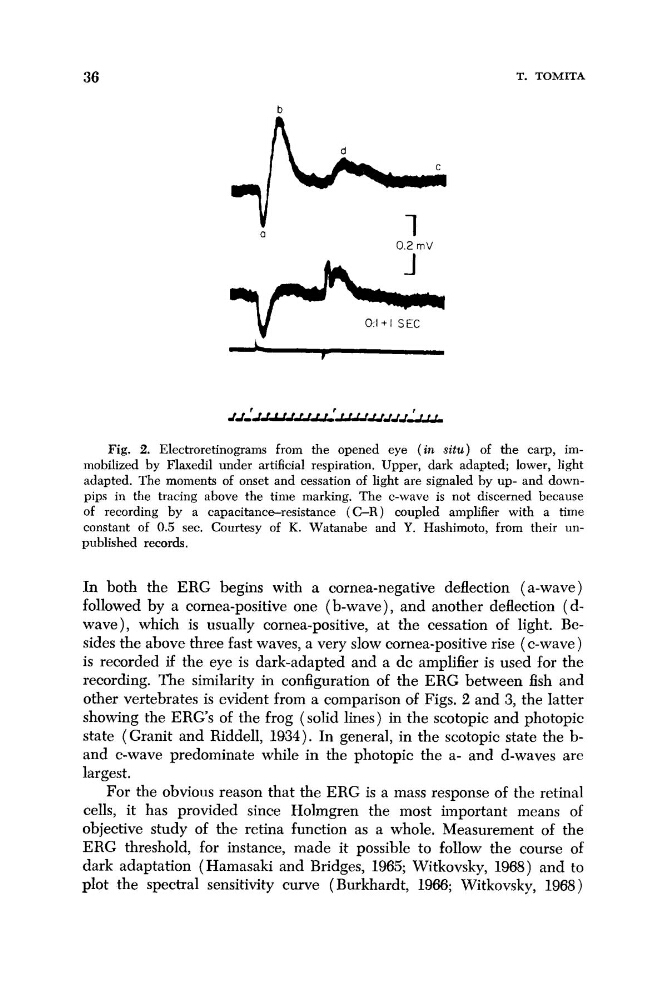
Fig. 2. Electroretinograms from the opened eye (in situ) of the carp, immobilized by Flaxedil under artificial respiration. Upper, dark adapted; lower, light
adapted. The moments of onset and cessation of light are signaled by up- and downpips in the tracing above the time marking. The c-wave is not discerned because
of recording by a capacitance-resistance (C-R) coupled amplifier with a time
constant of 0.5 sec. Courtesy of K. Watanabe and Y. Hashimoto, from their unpublished records.
In both the ERG begins with a cornea-negative deflection (a-wave)
followed by a cornea-positive one (b-wave), and another deflection (dwave), which is usually cornea-positive, at the cessation of light. Besides the above three fast waves, a very slow comea-positive rise (c-wave)
is recorded if the eye is dark-adapted and a dc amplifier is used for the
recording. The similarity in configuration of the ERG between fish and
other vertebrates is evident from a comparison of Figs. 2 and 3, the latter
showing the ERG'S of the frog (solid lines) in the scotopic and photopic
state (Granit and Riddell, 1934). In general, in the scotopic state the band c-wave predominate while in the photopic the a- and d-waves are
largest.
For the obvious reason that the ERG is a mass response of the retinal
cells, it has provided since Holmgren the most important means of
objective study of the retina function as a whole. Measurement of the
ERG threshold, for instance, made it possible to follow the course of
dark adaptation (Hamasaki and Bridges, 1965; Witkovsky, 1968) and to
plot the spectral sensitivity curve ( Burkhardt, 1966; Witkovsky, 1968)
b
T. TOMITA
0.2 rnV
Fig. 2. Electroretinograms from the opened eye (in situ) of the carp, immobilized by Flaxedil under artificial respiration. Upper, dark adapted; lower, light
adapted. The moments of onset and cessation of light are signaled by up- and downpips in the tracing above the time marking. The c-wave is not discerned because
of recording by a capacitance-resistance (C-R) coupled amplifier with a time
constant of 0.5 sec. Courtesy of K. Watanabe and Y. Hashimoto, from their unpublished records.
In both the ERG begins with a cornea-negative deflection (a-wave)
followed by a cornea-positive one (b-wave), and another deflection (dwave), which is usually cornea-positive, at the cessation of light. Besides the above three fast waves, a very slow comea-positive rise (c-wave)
is recorded if the eye is dark-adapted and a dc amplifier is used for the
recording. The similarity in configuration of the ERG between fish and
other vertebrates is evident from a comparison of Figs. 2 and 3, the latter
showing the ERG'S of the frog (solid lines) in the scotopic and photopic
state (Granit and Riddell, 1934). In general, in the scotopic state the band c-wave predominate while in the photopic the a- and d-waves are
largest.
For the obvious reason that the ERG is a mass response of the retinal
cells, it has provided since Holmgren the most important means of
objective study of the retina function as a whole. Measurement of the
ERG threshold, for instance, made it possible to follow the course of
dark adaptation (Hamasaki and Bridges, 1965; Witkovsky, 1968) and to
plot the spectral sensitivity curve ( Burkhardt, 1966; Witkovsky, 1968)