

F. W. MUNZ
24
470
480
490
500
510
520
530
540
A, , ,
(nm)
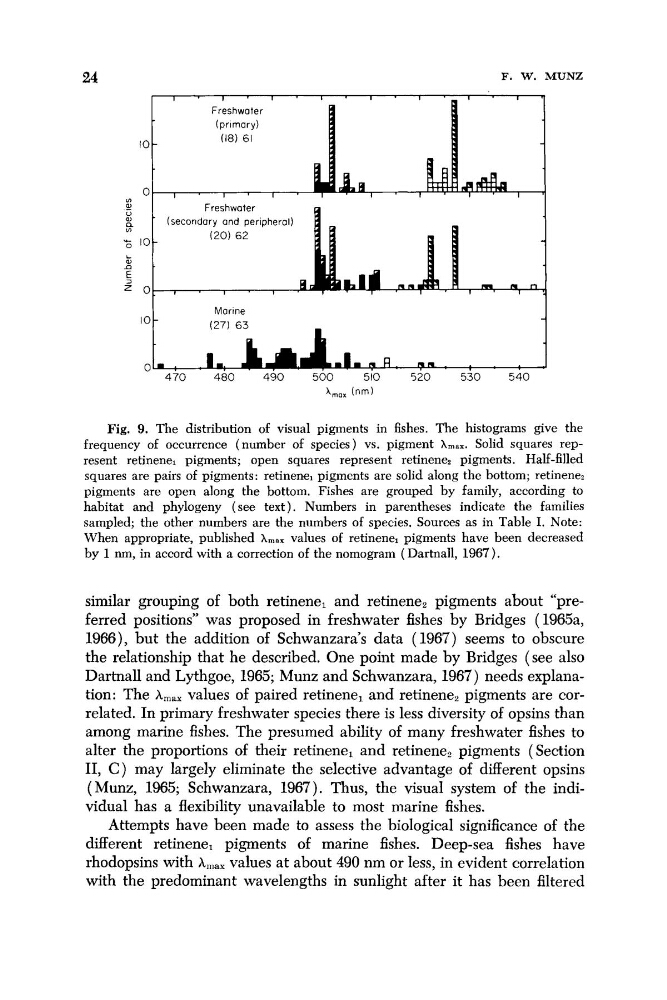
Fig. 9. The distribution of visual pigments in fishes. The histograms give the
frequency of occurrence (number of species) vs. pigment x , , , . Solid squares represent retinenel pigments; open squares represent retinenez pigments. Half-filled
squares are pairs of pigments: retinenel pigments are solid along the bottom; retinene?
pigments are open along the bottom. Fishes are grouped by family, according to
habitat and phylogeny (see text). Numbers in parentheses indicate the families
sampled; the other numbers are the numbers of species. Sources as in Table I. Note:
When appropriate, published Amax values of retinenel pigments have been decreased
by 1 nm, in accord with a correction of the nomogram (Dartnall, 1967).
similar grouping of both retinene, and retinene, pigments about “preferred positions” was proposed in freshwater fishes by Bridges (1965a,
1966), but the addition of Schwanzara’s data (1967) seems to obscure
the relationship that he described. One point made by Bridges (see also
Dartnall and Lythgoe, 1965; Munz and Schwanzara, 1967) needs explanation: The A
,
,
,
values of paired retinene, and retinene, pigments are correlated. In primary freshwater species there is less diversity of opsins than
among marine fishes. The presumed ability of many freshwater fishes to
alter the proportions of their retinene, and retinenez pigments (Section
11, C ) may largely eliminate the selective advantage of different opsins
(Munz, 1965; Schwanzara, 1967). Thus, the visual system of the individual has a flexibility unavailable to most marine fishes.
Attempts have been made to assess the biological significance of the
different retinene, pigments of marine fishes. Deep-sea fishes have
rhodopsins with A,,,,, values at about 490 nm or less, in evident correlation
with the predominant wavelengths in sunlight after it has been filtered
24
470
480
490
500
510
520
530
540
A, , ,
(nm)
Fig. 9. The distribution of visual pigments in fishes. The histograms give the
frequency of occurrence (number of species) vs. pigment x , , , . Solid squares represent retinenel pigments; open squares represent retinenez pigments. Half-filled
squares are pairs of pigments: retinenel pigments are solid along the bottom; retinene?
pigments are open along the bottom. Fishes are grouped by family, according to
habitat and phylogeny (see text). Numbers in parentheses indicate the families
sampled; the other numbers are the numbers of species. Sources as in Table I. Note:
When appropriate, published Amax values of retinenel pigments have been decreased
by 1 nm, in accord with a correction of the nomogram (Dartnall, 1967).
similar grouping of both retinene, and retinene, pigments about “preferred positions” was proposed in freshwater fishes by Bridges (1965a,
1966), but the addition of Schwanzara’s data (1967) seems to obscure
the relationship that he described. One point made by Bridges (see also
Dartnall and Lythgoe, 1965; Munz and Schwanzara, 1967) needs explanation: The A
,
,
,
values of paired retinene, and retinene, pigments are correlated. In primary freshwater species there is less diversity of opsins than
among marine fishes. The presumed ability of many freshwater fishes to
alter the proportions of their retinene, and retinenez pigments (Section
11, C ) may largely eliminate the selective advantage of different opsins
(Munz, 1965; Schwanzara, 1967). Thus, the visual system of the individual has a flexibility unavailable to most marine fishes.
Attempts have been made to assess the biological significance of the
different retinene, pigments of marine fishes. Deep-sea fishes have
rhodopsins with A,,,,, values at about 490 nm or less, in evident correlation
with the predominant wavelengths in sunlight after it has been filtered