

282
J. DIAMOND
..mu
-.
0
-
i
0
1
I I I i
gressively larger, both in its ipsilateral and contralateral components,
until at a separation time of 25 msec it attained its maximum size.
* I # .
-100
*
. .
-80
. .
. .
0 . 8
. .
9 :
-60
-40
. . .
-20
' I
. . .
L - .
-
I
I
I
I
1
D. The Minimum Discrimination Time
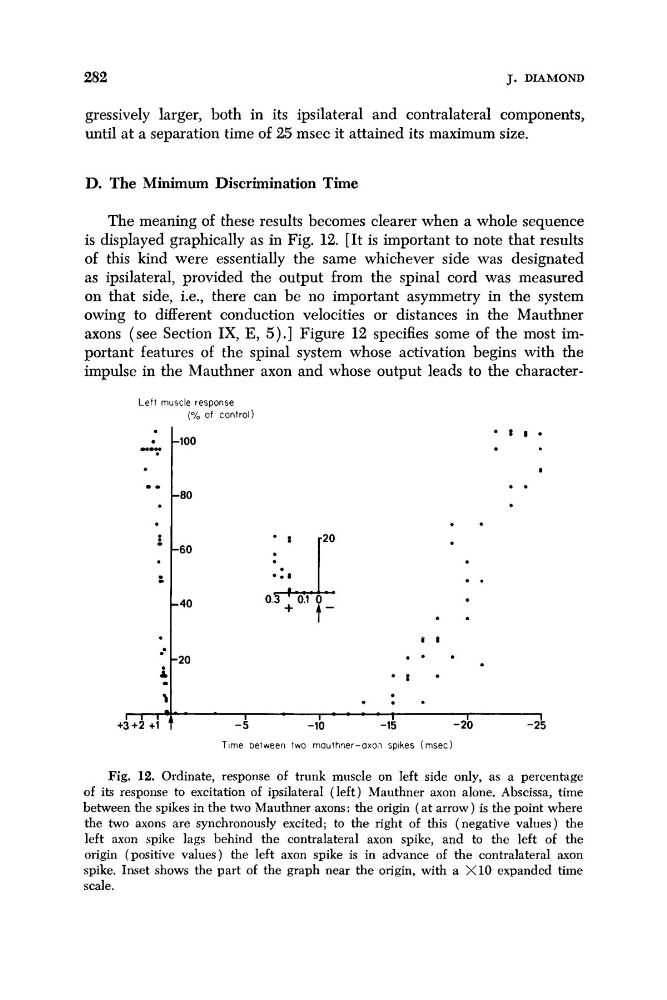
The meaning of these results becomes clearer when a whole sequence
is displayed graphically as in Fig. 12. [It is important to note that results
of this kind were essentially the same whichever side was designated
as ipsilateral, provided the output from the spinal cord was measured
on that side, i.e., there can be no important asymmetry in the system
owing to different conduction velocities or distances in the Mauthner
axons (see Section IX, E, 5 ) . ] Figure 12 specifies some of the most important features of the spinal system whose activation begins with the
impulse in the Mauthner axon and whose output leads to the characterL e f t muscle response
(% of control)
Time between two mouthier-axon spikes (rnsec)
Fig. 12. Ordinate, response of trunk muscle on left side only, as a percentage
of its response to excitation of ipsilateral (left) Mauthner axon alone. Abscissa, time
between the spikes in the two Mauthner axons: the origin ( a t arrow) is the point where
the two axons are synchronously excited; to the right of this (negative values) the
left axon spike lags behind the contralateral axon spike, and to the left of the
origin (positive values) the left axon spike is in advance of the contralateral axon
spike. Inset shows the part of the graph near the origin, with a X10 expanded time
scale.
J. DIAMOND
..mu
-.
0
-
i
0
1
I I I i
gressively larger, both in its ipsilateral and contralateral components,
until at a separation time of 25 msec it attained its maximum size.
* I # .
-100
*
. .
-80
. .
. .
0 . 8
. .
9 :
-60
-40
. . .
-20
' I
. . .
L - .
-
I
I
I
I
1
D. The Minimum Discrimination Time
The meaning of these results becomes clearer when a whole sequence
is displayed graphically as in Fig. 12. [It is important to note that results
of this kind were essentially the same whichever side was designated
as ipsilateral, provided the output from the spinal cord was measured
on that side, i.e., there can be no important asymmetry in the system
owing to different conduction velocities or distances in the Mauthner
axons (see Section IX, E, 5 ) . ] Figure 12 specifies some of the most important features of the spinal system whose activation begins with the
impulse in the Mauthner axon and whose output leads to the characterL e f t muscle response
(% of control)
Time between two mouthier-axon spikes (rnsec)
Fig. 12. Ordinate, response of trunk muscle on left side only, as a percentage
of its response to excitation of ipsilateral (left) Mauthner axon alone. Abscissa, time
between the spikes in the two Mauthner axons: the origin ( a t arrow) is the point where
the two axons are synchronously excited; to the right of this (negative values) the
left axon spike lags behind the contralateral axon spike, and to the left of the
origin (positive values) the left axon spike is in advance of the contralateral axon
spike. Inset shows the part of the graph near the origin, with a X10 expanded time
scale.