

4. THYROID FUNCTION AND ITS CONTROL IN FISHES
257
U
0
' I -
.3 I
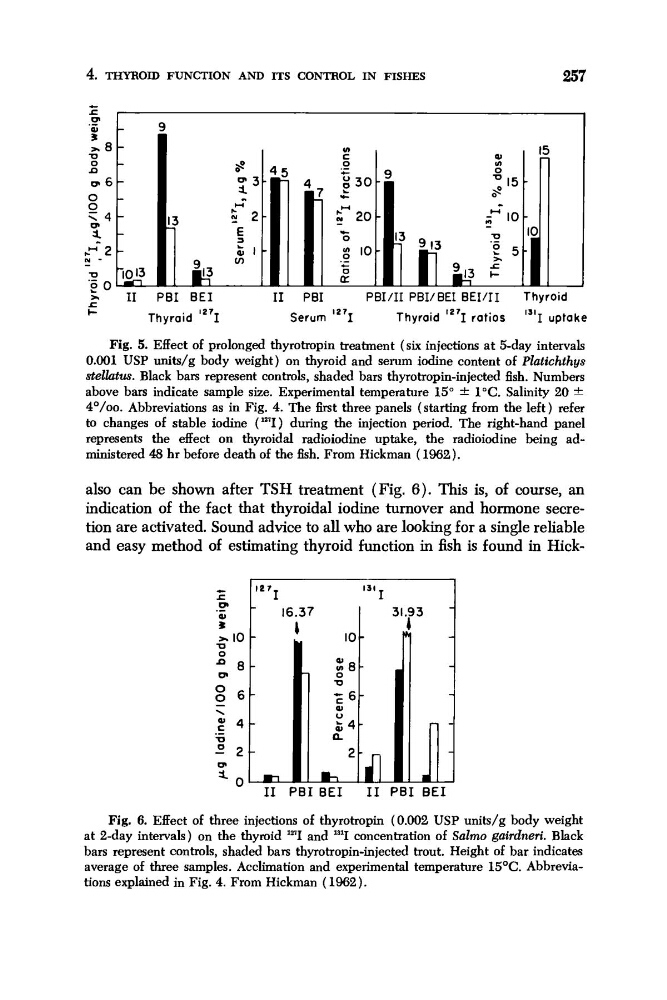
Fig. 5. Effect of prolonged thyrotropin treatment (six injections at 5-day intervals
0.001 USP units/g body weight) on thyroid and serum iodine content of Platichthys
stellatus. Black bars represent controls, shaded bars thyrotropin-injected fish. Numbers
above bars indicate sample size. Experimental temperature 15" 1°C. Salinity 20 *
4O/oo. Abbreviations as in Fig. 4. The first three panels (starting from the left) refer
to changes of stable iodine ('9) during the injection period. The right-hand panel
represents the effect on thyroidal radioiodine uptake, the radioiodine being administered 48 hr before death of the fish. From Hickman ( 1962).
also can be shown after TSH treatment (Fig. 6). This is, of course, an
indication of the fact that thyroidal iodine turnover and hormone secretion are activated. Sound advice to all who are looking for a single reliable
and easy method of estimating thyroid function in fish is found in Hicke 7 ~
13' I
16.37
I
31.93
m
I1
b P B I 1
PBI BE1
Fig. 6. Effect of three injections of thyrotropin (0.002 USP units/g body weight
at 2-day intervals) on the thyroid "' 1 and lalI concentration of Salrno gairdneri. Black
bars represent controls, shaded bars thyrotropin-injected trout. Height of bar indicates
average of three samples. Acclimation and experimental temperature 15OC. Abbreviations explained in Fig. 4. From Hickman ( 1962).
257
U
0
' I -
.3 I
Fig. 5. Effect of prolonged thyrotropin treatment (six injections at 5-day intervals
0.001 USP units/g body weight) on thyroid and serum iodine content of Platichthys
stellatus. Black bars represent controls, shaded bars thyrotropin-injected fish. Numbers
above bars indicate sample size. Experimental temperature 15" 1°C. Salinity 20 *
4O/oo. Abbreviations as in Fig. 4. The first three panels (starting from the left) refer
to changes of stable iodine ('9) during the injection period. The right-hand panel
represents the effect on thyroidal radioiodine uptake, the radioiodine being administered 48 hr before death of the fish. From Hickman ( 1962).
also can be shown after TSH treatment (Fig. 6). This is, of course, an
indication of the fact that thyroidal iodine turnover and hormone secretion are activated. Sound advice to all who are looking for a single reliable
and easy method of estimating thyroid function in fish is found in Hicke 7 ~
13' I
16.37
I
31.93
m
I1
b P B I 1
PBI BE1
Fig. 6. Effect of three injections of thyrotropin (0.002 USP units/g body weight
at 2-day intervals) on the thyroid "' 1 and lalI concentration of Salrno gairdneri. Black
bars represent controls, shaded bars thyrotropin-injected trout. Height of bar indicates
average of three samples. Acclimation and experimental temperature 15OC. Abbreviations explained in Fig. 4. From Hickman ( 1962).