

428
JOHAN B. STEEN
Pressure (atm)
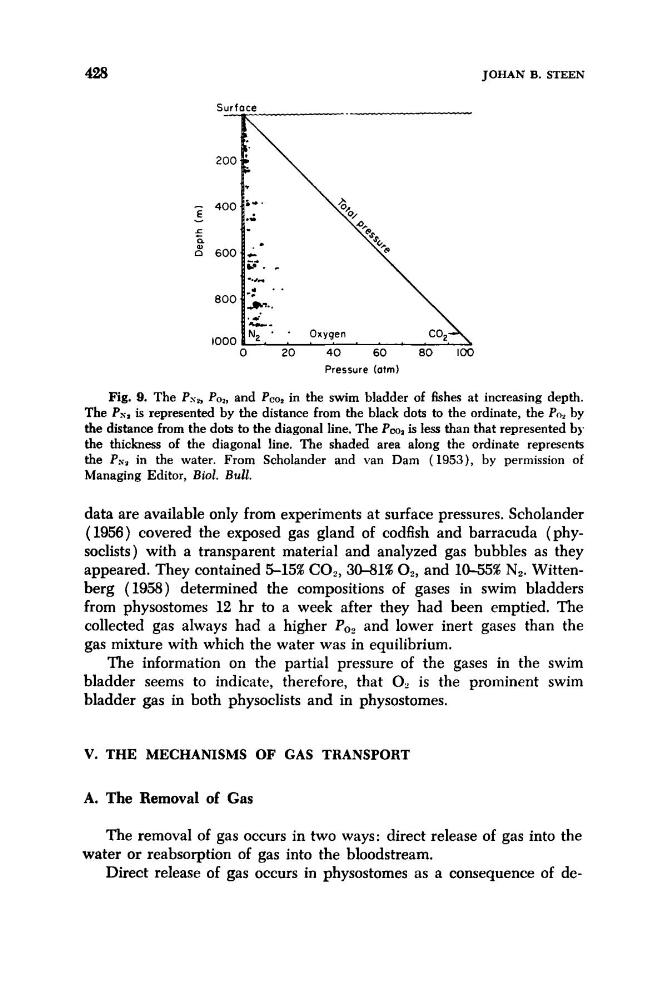
Fig. 9. The Ps,, Po,, and P,O, in the swim bladder of fishes at increasing depth.
The Ps, is represented by the distance from the black dots to the ordinate, the PO, by
the distance from the dots to the diagonal line. The POO, is less than that represented by
the thickness of the diagonal line. The shaded area along the ordinate represents
the Pm in the water. From Scholander and van Dam (1953), by permission of
Managing Editor, Biol. Bull.
data are available only from experiments at surface pressures. Scholander
(1956) covered the exposed gas gland of codfish and barracuda (physoclists) with a transparent material and analyzed gas bubbles as they
appeared. They contained 5 1 5 % CO?, 30431% 0,, and 1055% N,. Wittenberg (1958) determined the compositions of gases in swim bladders
from physostomes 12 hr to a week after they had been emptied. The
collected gas always had a higher Po, and lower inert gases than the
gas mixture with which the water was in equilibrium.
The information on the partial pressure of the gases in the swim
bladder seems to indicate, therefore, that 0, is the prominent swim
bladder gas in both physoclists and in physostomes.
V. THE MECHANISMS OF GAS TRANSPORT
A. The Removal of Gas
The removal of gas occurs in two ways: direct release of gas into the
Direct release of gas occurs in physostomes as a consequence of dewater or reabsorption of gas into the bloodstream.
JOHAN B. STEEN
Pressure (atm)
Fig. 9. The Ps,, Po,, and P,O, in the swim bladder of fishes at increasing depth.
The Ps, is represented by the distance from the black dots to the ordinate, the PO, by
the distance from the dots to the diagonal line. The POO, is less than that represented by
the thickness of the diagonal line. The shaded area along the ordinate represents
the Pm in the water. From Scholander and van Dam (1953), by permission of
Managing Editor, Biol. Bull.
data are available only from experiments at surface pressures. Scholander
(1956) covered the exposed gas gland of codfish and barracuda (physoclists) with a transparent material and analyzed gas bubbles as they
appeared. They contained 5 1 5 % CO?, 30431% 0,, and 1055% N,. Wittenberg (1958) determined the compositions of gases in swim bladders
from physostomes 12 hr to a week after they had been emptied. The
collected gas always had a higher Po, and lower inert gases than the
gas mixture with which the water was in equilibrium.
The information on the partial pressure of the gases in the swim
bladder seems to indicate, therefore, that 0, is the prominent swim
bladder gas in both physoclists and in physostomes.
V. THE MECHANISMS OF GAS TRANSPORT
A. The Removal of Gas
The removal of gas occurs in two ways: direct release of gas into the
Direct release of gas occurs in physostomes as a consequence of dewater or reabsorption of gas into the bloodstream.