

8. THE REGULATION OF BREATHING
345
I
I
I
1
1
I
1
I
4 0 -
pco,
20 -
-
0 -
Water, R = l
-
-
-
VG. 200
240
480
960
p*
L
1
I
I
I
I
I
I
20
4 0
60
8 0
100
120
140
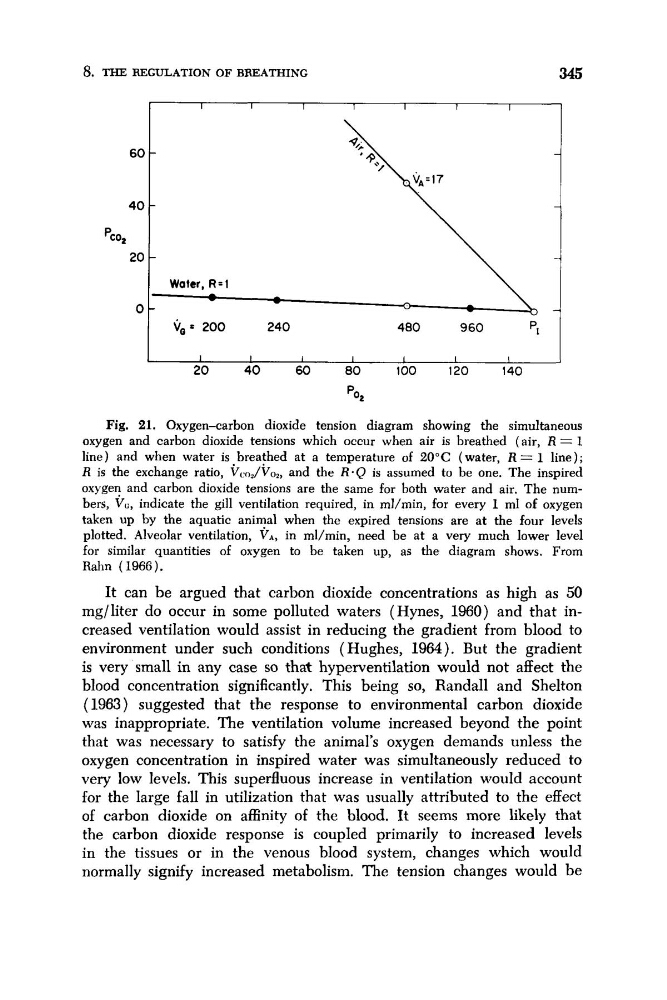
Fig. 21. Oxygen-carbon dioxide tension diagram showing the simultaneous
oxygen and carbon dioxide tensions which occur when air is breathed (air, R = 1
line) and when water is .breafhed at a temperature of 20°C (water, R = 1 line);
R is the exchange ratio, Vco2/Vo2, and the R.Q is assumed to be one. The inspired
oxygen and carbon dioxide tensions are the same for both water and air. The numbers, Vc, indicate the gill ventilation required, in ml/min, for every 1 ml of oxygen
taken up by the aquatic animal when the expired tensions are at the four levels
plotted. Alveolar ventilation, VA, in ml/min, need be at a very much lower level
for similar quantities of oxygen to be taken up, as the diagram shows. From
Rahn (1966).
It can be argued that carbon dioxide concentrations as high as 50
mg/liter do occur in some polluted waters (Hynes, 1960) and that increased ventilation would assist in reducing the gradient from blood to
environment under such conditions (Hughes, 1964). But the gradient
is very small in any case so that hyperventilation would not affect the
blood concentration significantly. This being so, Randall and Shelton
(1963) suggested that the response to environmental carbon dioxide
was inappropriate. The ventilation volume increased beyond the point
that was necessary to satisfy the animal's oxygen demands unless the
oxygen concentration in inspired water was simultaneously reduced to
very low levels. This superfluous increase in ventilation would account
for the large fall in utilization that was usually attributed to the effect
of carbon dioxide on affinity of the blood. It seems more likely that
the carbon dioxide response is coupled primarily to increased levels
in the tissues or in the venous blood system, changes which would
normally signify increased metabolism. The tension changes would be
345
I
I
I
1
1
I
1
I
4 0 -
pco,
20 -
-
0 -
Water, R = l
-
-
-
VG. 200
240
480
960
p*
L
1
I
I
I
I
I
I
20
4 0
60
8 0
100
120
140
Fig. 21. Oxygen-carbon dioxide tension diagram showing the simultaneous
oxygen and carbon dioxide tensions which occur when air is breathed (air, R = 1
line) and when water is .breafhed at a temperature of 20°C (water, R = 1 line);
R is the exchange ratio, Vco2/Vo2, and the R.Q is assumed to be one. The inspired
oxygen and carbon dioxide tensions are the same for both water and air. The numbers, Vc, indicate the gill ventilation required, in ml/min, for every 1 ml of oxygen
taken up by the aquatic animal when the expired tensions are at the four levels
plotted. Alveolar ventilation, VA, in ml/min, need be at a very much lower level
for similar quantities of oxygen to be taken up, as the diagram shows. From
Rahn (1966).
It can be argued that carbon dioxide concentrations as high as 50
mg/liter do occur in some polluted waters (Hynes, 1960) and that increased ventilation would assist in reducing the gradient from blood to
environment under such conditions (Hughes, 1964). But the gradient
is very small in any case so that hyperventilation would not affect the
blood concentration significantly. This being so, Randall and Shelton
(1963) suggested that the response to environmental carbon dioxide
was inappropriate. The ventilation volume increased beyond the point
that was necessary to satisfy the animal's oxygen demands unless the
oxygen concentration in inspired water was simultaneously reduced to
very low levels. This superfluous increase in ventilation would account
for the large fall in utilization that was usually attributed to the effect
of carbon dioxide on affinity of the blood. It seems more likely that
the carbon dioxide response is coupled primarily to increased levels
in the tissues or in the venous blood system, changes which would
normally signify increased metabolism. The tension changes would be