

332
G. SHELTON
I
1
I
2000
3000
4000
Ventilation volume (ml/min/kg)
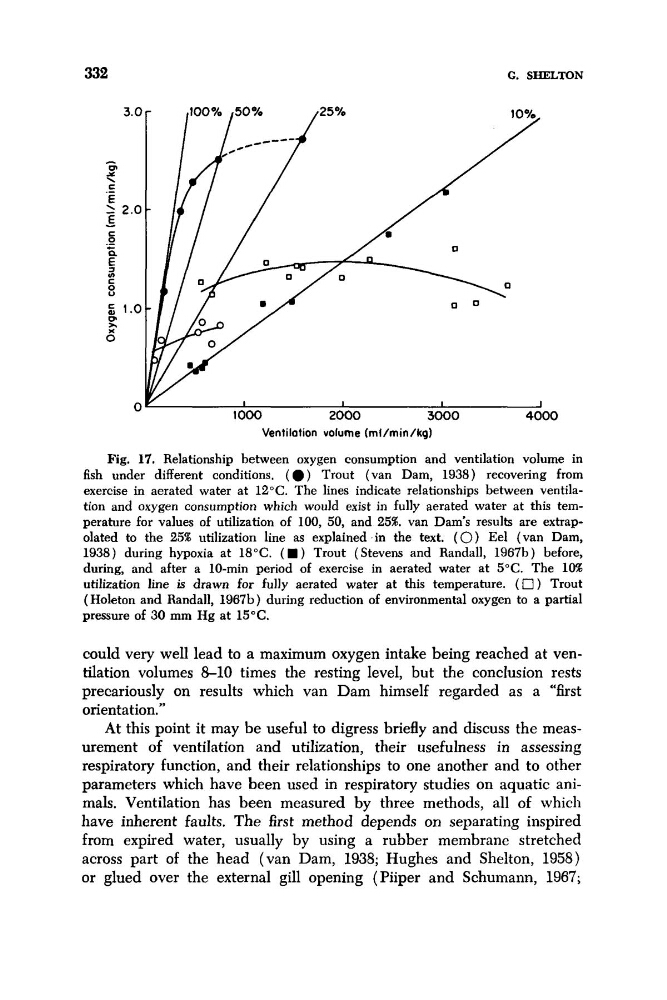
Fig. 17. Relationship between oxygen consumption and ventilation volume in
fish under different conditions. ( 0 ) Trout (van Dam, 1938) recovering from
exercise in aerated water at 12°C. The lines indicate relationships between ventilation and oxygen consumption which would exist in fully aerated water at this temperature for values of utilization of 100, 50, and 25%. van Dam’s results are extrapolated to the 25% utilization line as explained -in the text. (0) Eel (van Dam,
1938) during hypoxia at 18°C. ( W ) Trout (Stevens and Randall, 1967b) before,
during, and after a 10-min period of exercise in aerated water at 5°C. The 10%
utilization line is drawn for fully aerated water at this temperature. (0) Trout
(Holeton and Randall, 1967b) during reduction of environmental oxygen to a partial
pressure of 30 mm Hg at 15°C.
could very well lead to a maximum oxygen intake being reached at ventilation volumes 8-10 times the resting level, but the conclusion rests
precariously on results which van Dam himself regarded as a “first
orientation.”
At this point it may be useful to digress briefly and discuss the measurement of ventilation and utilization, their usefulness in assessing
respiratory function, and their relationships to one another and to other
parameters which have been used in respiratory studies on aquatic animals. Ventilation has been measured by three methods, all of which
have inherent faults. The first method depends on separating inspired
from expired water, usually by using a rubber membrane stretched
across part of the head (van Dam, 1938; Hughes and Shelton, 1958)
or glued over the external gill opening (Piiper and Schumann, 1967;
G. SHELTON
I
1
I
2000
3000
4000
Ventilation volume (ml/min/kg)
Fig. 17. Relationship between oxygen consumption and ventilation volume in
fish under different conditions. ( 0 ) Trout (van Dam, 1938) recovering from
exercise in aerated water at 12°C. The lines indicate relationships between ventilation and oxygen consumption which would exist in fully aerated water at this temperature for values of utilization of 100, 50, and 25%. van Dam’s results are extrapolated to the 25% utilization line as explained -in the text. (0) Eel (van Dam,
1938) during hypoxia at 18°C. ( W ) Trout (Stevens and Randall, 1967b) before,
during, and after a 10-min period of exercise in aerated water at 5°C. The 10%
utilization line is drawn for fully aerated water at this temperature. (0) Trout
(Holeton and Randall, 1967b) during reduction of environmental oxygen to a partial
pressure of 30 mm Hg at 15°C.
could very well lead to a maximum oxygen intake being reached at ventilation volumes 8-10 times the resting level, but the conclusion rests
precariously on results which van Dam himself regarded as a “first
orientation.”
At this point it may be useful to digress briefly and discuss the measurement of ventilation and utilization, their usefulness in assessing
respiratory function, and their relationships to one another and to other
parameters which have been used in respiratory studies on aquatic animals. Ventilation has been measured by three methods, all of which
have inherent faults. The first method depends on separating inspired
from expired water, usually by using a rubber membrane stretched
across part of the head (van Dam, 1938; Hughes and Shelton, 1958)
or glued over the external gill opening (Piiper and Schumann, 1967;