

404
C. B. COWEY AND J. R. SAROENT
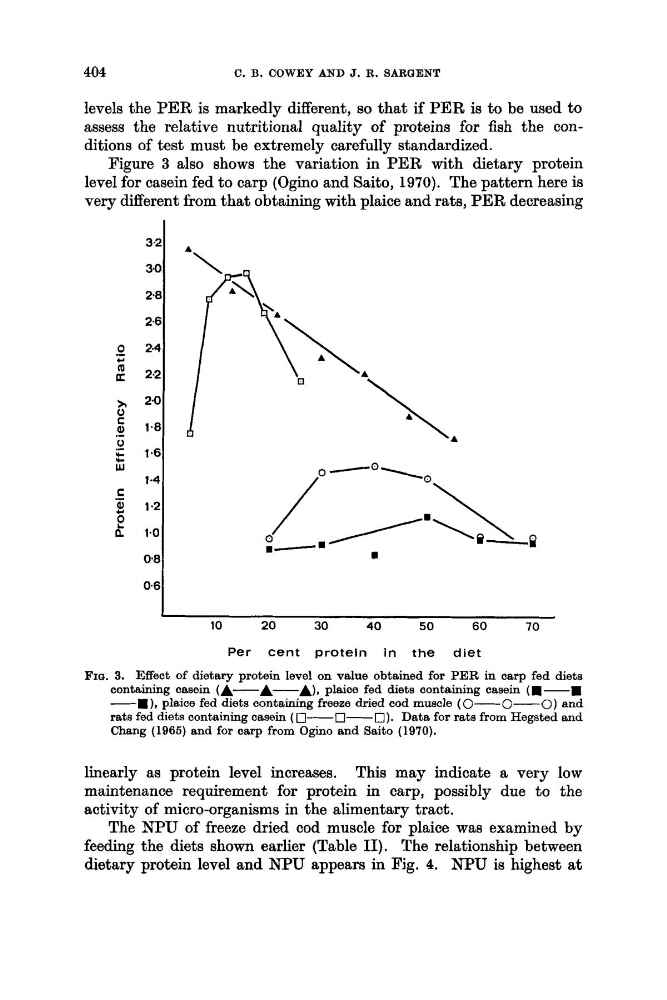
levels the PER is markedly different, so that if PER is to be used to
assess the relative nutritional quality of proteins for fish the conditions of test must be extremely carefully standardized.
Figure 3 also shows the variation in PER with dietary protein
level for casein fed to carp (Ogino and Saito, 1970). The pattern here is
very different from that obtaining with plaice and rats, PER decreasing
0
(II
-
L
C
Q)
.L
2
a
30
2.8
2.6
2.4
2.2
2.0
1.8
1 *6
1 *4
1 -2
1.0
0 8
o.6L
3.2
2.4
2.2
A
2.0
1.8
1 *6
1 *4
1 -2
1.0
1
0
0 - O
0 8
m
0.6
10
20
30
40
50
60
70
0 - O
1
0
m
10
20
30
40
50
60
70
Per cent protein in the diet
FIG. 3. Effect of dietary protein level on value obtained for PER in carp fed diets
containing casein (A-A-A),
plaice fed diets containing casein (m-.
-a), plaice fed diets containing freeze dried cod muscle (0-0-0) and
rats fed diets containing casein (0-0-0).
Data, for rats from Hegsted and
Chang (1965) and for carp from Ogino and Saito (1970).
linearly as protein level increases. This may indicate a very low
maintenance requirement for protein in carp, possibly due to the
activity of micro-organisms in the alimentary tract.
The NPU of freeze dried cod muscle for plaice was examined by
feeding the diets shown earlier (Table 11). The relationship between
dietary protein level and NPU appears in Fig. 4. NPU is highest at
C. B. COWEY AND J. R. SAROENT
levels the PER is markedly different, so that if PER is to be used to
assess the relative nutritional quality of proteins for fish the conditions of test must be extremely carefully standardized.
Figure 3 also shows the variation in PER with dietary protein
level for casein fed to carp (Ogino and Saito, 1970). The pattern here is
very different from that obtaining with plaice and rats, PER decreasing
0
(II
-
L
C
Q)
.L
2
a
30
2.8
2.6
2.4
2.2
2.0
1.8
1 *6
1 *4
1 -2
1.0
0 8
o.6L
3.2
2.4
2.2
A
2.0
1.8
1 *6
1 *4
1 -2
1.0
1
0
0 - O
0 8
m
0.6
10
20
30
40
50
60
70
0 - O
1
0
m
10
20
30
40
50
60
70
Per cent protein in the diet
FIG. 3. Effect of dietary protein level on value obtained for PER in carp fed diets
containing casein (A-A-A),
plaice fed diets containing casein (m-.
-a), plaice fed diets containing freeze dried cod muscle (0-0-0) and
rats fed diets containing casein (0-0-0).
Data, for rats from Hegsted and
Chang (1965) and for carp from Ogino and Saito (1970).
linearly as protein level increases. This may indicate a very low
maintenance requirement for protein in carp, possibly due to the
activity of micro-organisms in the alimentary tract.
The NPU of freeze dried cod muscle for plaice was examined by
feeding the diets shown earlier (Table 11). The relationship between
dietary protein level and NPU appears in Fig. 4. NPU is highest at