

230
BILARY B. MOORE
the whole intertidal zone), and so obtained the mean range for each
zone.
The vertical distribution of the two statistics on the shore followed
the same pattern, but with one the mirror image of the other. We
therefore combined the two by expressing the individual values in
each as deviations from the mean of the series, reversing the signs of
one series, and then taking the mean of the two values for each zone.
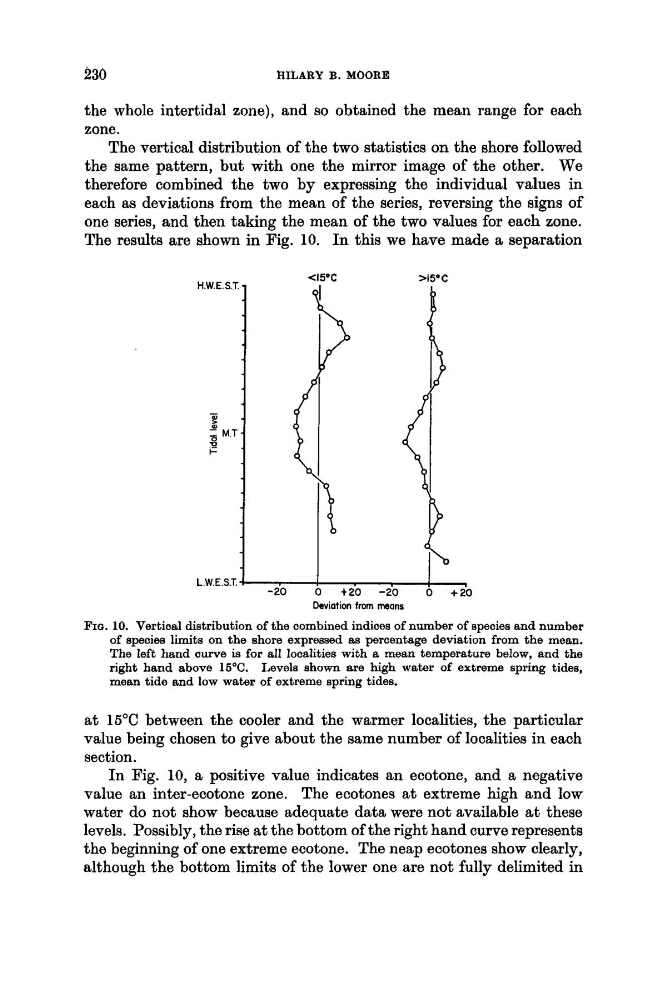
The results are shown in Fig. 10. In this we have made a separation
FIQ. 10. Vertical distribution of the combined indices of number of species and number
of species limits on the shore expressed as percentage deviation from the mean.
The left hand curve is for all loadities with a mean temperature below, and the
right hand above 16°C. Levels shown are high water of extreme spring tides,
mean tide and low water of extreme spring tides.
at 16°C between the cooler and the warmer localitiee, the particular
value being chosen to give about the same number of Iocalities in each
section.
In Fig. 10, a positive value indicates an ecotone, and a negative
value an inter-ecotone zone. The ecotones at extreme high and low
water do not show because adequate data were not available at these
levels. Possibly, the rise at the bottom of the right hand curve represents
the beginning of one extreme ecotone. The neap ecotones show clearly,
although the bottom limits of the lower one are not fully delimited in
BILARY B. MOORE
the whole intertidal zone), and so obtained the mean range for each
zone.
The vertical distribution of the two statistics on the shore followed
the same pattern, but with one the mirror image of the other. We
therefore combined the two by expressing the individual values in
each as deviations from the mean of the series, reversing the signs of
one series, and then taking the mean of the two values for each zone.
The results are shown in Fig. 10. In this we have made a separation
FIQ. 10. Vertical distribution of the combined indices of number of species and number
of species limits on the shore expressed as percentage deviation from the mean.
The left hand curve is for all loadities with a mean temperature below, and the
right hand above 16°C. Levels shown are high water of extreme spring tides,
mean tide and low water of extreme spring tides.
at 16°C between the cooler and the warmer localitiee, the particular
value being chosen to give about the same number of Iocalities in each
section.
In Fig. 10, a positive value indicates an ecotone, and a negative
value an inter-ecotone zone. The ecotones at extreme high and low
water do not show because adequate data were not available at these
levels. Possibly, the rise at the bottom of the right hand curve represents
the beginning of one extreme ecotone. The neap ecotones show clearly,
although the bottom limits of the lower one are not fully delimited in