

422
N. BALAKRZSHNAN NAIE AND M. SARASWATHY
I
20 -
70 -
120 -
170220 -
270 -
- 14
- 15
- 37
- 1 9
- 30
A
- 72
- 210
‘36
- 472
- 494
-417
B
-219
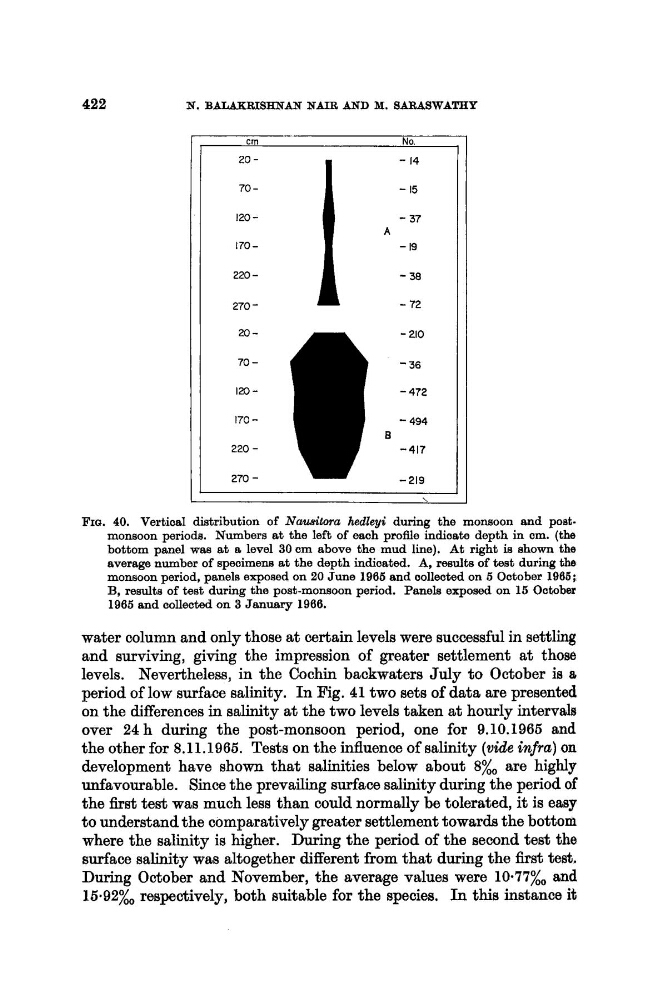
FIG. 40. Vertical distribution of Nawitom hedleyi during the monsoon and postmonsoon periods. Numbers at the left of each profile indicate depth in am. (the
bottom panel was a t e level 30 cm above the mud line). At right ia shown the
average number of specimens at the depth indicated. A, results of test during the
monsoon period, panels exposed on 20 June 1966 and collected on 6 October 1966;
B, results of test during the post-monsoon period. Panels exposed on 16 October
1966 end collected on 3 January 1966.
water column and only those at certain levels were successful in settling
and surviving, giving the impression of greater settlement at those
levels. Nevertheless, in the Cochin backwaters July t o October is 8
period of low surface salinity. In Fig. 41 two sets of data are presented
on the differences in salinity at the two levels taken at hourly intervah
over 24h during the post-monsoon period, one for 9.10.1965 and
the other for 8.11.1965. Tests on the influence of salinity (wide infra) on
development have shown that salinities below about S%, are higbly
unfavourable. Since the prevailing surface salinity during the period of
the first test was much less than could normally be tolerated, it is easy
to understand the comparatively greater settlement towards the bottom
where the salinity is higher. During the period of the second test the
surface salinity was altogether different from that during the first test.
During October and November, the average values were 10.77%,, and
1 6 ~ 9 2 % ~
respectively, both suitable for the species. In this instance it
N. BALAKRZSHNAN NAIE AND M. SARASWATHY
I
20 -
70 -
120 -
170220 -
270 -
- 14
- 15
- 37
- 1 9
- 30
A
- 72
- 210
‘36
- 472
- 494
-417
B
-219
FIG. 40. Vertical distribution of Nawitom hedleyi during the monsoon and postmonsoon periods. Numbers at the left of each profile indicate depth in am. (the
bottom panel was a t e level 30 cm above the mud line). At right ia shown the
average number of specimens at the depth indicated. A, results of test during the
monsoon period, panels exposed on 20 June 1966 and collected on 6 October 1966;
B, results of test during the post-monsoon period. Panels exposed on 16 October
1966 end collected on 3 January 1966.
water column and only those at certain levels were successful in settling
and surviving, giving the impression of greater settlement at those
levels. Nevertheless, in the Cochin backwaters July t o October is 8
period of low surface salinity. In Fig. 41 two sets of data are presented
on the differences in salinity at the two levels taken at hourly intervah
over 24h during the post-monsoon period, one for 9.10.1965 and
the other for 8.11.1965. Tests on the influence of salinity (wide infra) on
development have shown that salinities below about S%, are higbly
unfavourable. Since the prevailing surface salinity during the period of
the first test was much less than could normally be tolerated, it is easy
to understand the comparatively greater settlement towards the bottom
where the salinity is higher. During the period of the second test the
surface salinity was altogether different from that during the first test.
During October and November, the average values were 10.77%,, and
1 6 ~ 9 2 % ~
respectively, both suitable for the species. In this instance it