

28
R. H. MILLAR
5 0
De ys
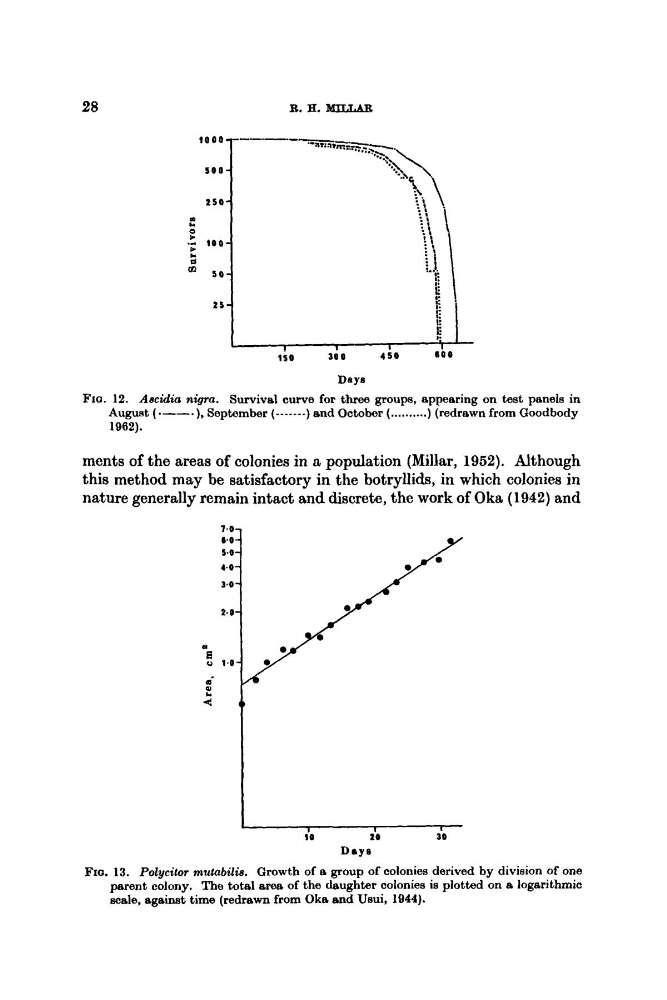
FIG. 12. Aacidia nigra. Survival curve for three groups, appearing on test panels in
August (.--.),
September (-------)and October (..........) (redrawn from Goodbody
1962).
ments of the areas of colonies in a population (Millar, 1952). Although
this method may be satisfactory in the botryllids, in which colonies in
nature generally remain intact and discrete, the work of Oka (1942) and
10
20
30
D a y s
FIQ. 13. Polycilor mufabilis. Growth of a group of colonies derived by division of one
parent colony. The total area of the daughter colonies is plotted on a logarithmic
scale, against time (redrawn from Oka and Usui, 1944).
R. H. MILLAR
5 0
De ys
FIG. 12. Aacidia nigra. Survival curve for three groups, appearing on test panels in
August (.--.),
September (-------)and October (..........) (redrawn from Goodbody
1962).
ments of the areas of colonies in a population (Millar, 1952). Although
this method may be satisfactory in the botryllids, in which colonies in
nature generally remain intact and discrete, the work of Oka (1942) and
10
20
30
D a y s
FIQ. 13. Polycilor mufabilis. Growth of a group of colonies derived by division of one
parent colony. The total area of the daughter colonies is plotted on a logarithmic
scale, against time (redrawn from Oka and Usui, 1944).