

282
D. #. CUSHMQ
data were fitted, by Lynn, to a harmonic regression by date. The high
correlat,ion of temperature with date shows the stable areas offshore,
whereas upwelling is shown by low correlation coefficients. Figure 8
shows tlic distribution of correlation coefficients and tho line has been
drawn by following the poor coefficients (using r < 0.75 as a criterion)
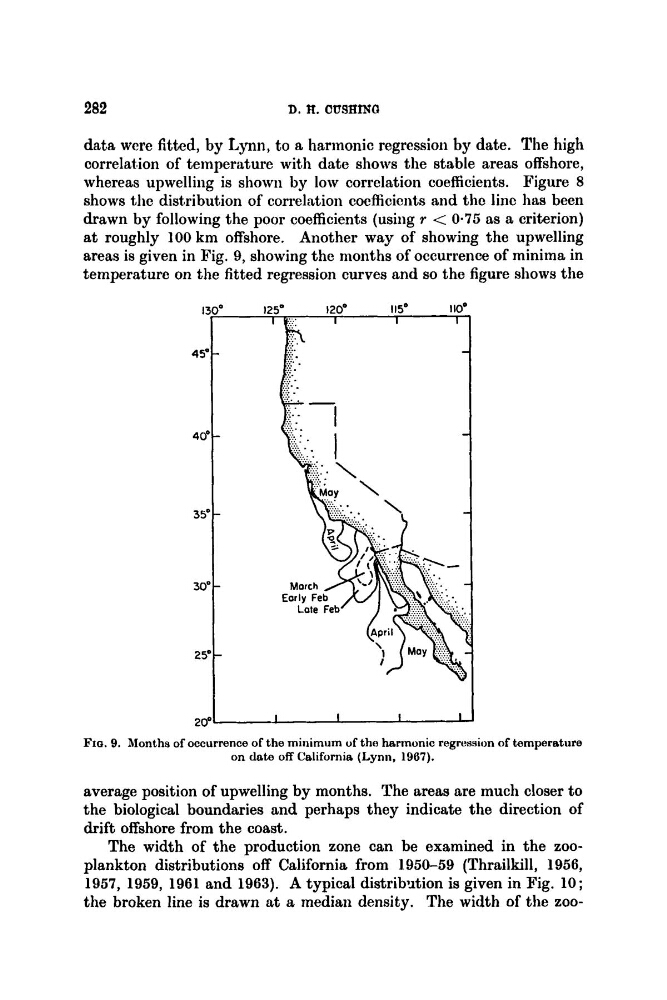
at roughly 100 km offshore. Another way of showing the upwelling
areas is given in Fig. 9, showing the months of occurrence of minima in
temperature on the fitted regression curves and so the figure shows the
20°
FIG. 9. Months of occurrence of the minimum of tho harmonic regression of temperature
on dote off California (Lynn, 1967).
average position of upwelling by months. The areas are much closer to
the biological boundaries and perhaps they indicate the direction of
drift offshore from the coast.
The width of the production zone can be examined in the zooplankton distributions off California from 1950-59 (Thrailkill, 1956,
1957, 1959, 1961 and 1963). A typical distriblltion is given in Fig. 10;
the broken line is drawn at a median density. The width of the ZOO-
D. #. CUSHMQ
data were fitted, by Lynn, to a harmonic regression by date. The high
correlat,ion of temperature with date shows the stable areas offshore,
whereas upwelling is shown by low correlation coefficients. Figure 8
shows tlic distribution of correlation coefficients and tho line has been
drawn by following the poor coefficients (using r < 0.75 as a criterion)
at roughly 100 km offshore. Another way of showing the upwelling
areas is given in Fig. 9, showing the months of occurrence of minima in
temperature on the fitted regression curves and so the figure shows the
20°
FIG. 9. Months of occurrence of the minimum of tho harmonic regression of temperature
on dote off California (Lynn, 1967).
average position of upwelling by months. The areas are much closer to
the biological boundaries and perhaps they indicate the direction of
drift offshore from the coast.
The width of the production zone can be examined in the zooplankton distributions off California from 1950-59 (Thrailkill, 1956,
1957, 1959, 1961 and 1963). A typical distriblltion is given in Fig. 10;
the broken line is drawn at a median density. The width of the ZOO-