

280
D. H. CUSHING
V. THE UPWELLING AREAS
There are four types of upwelling area : (1) those in the main eastern
boundary currents; (2) those in the Indian Ocean; (3) those in the
equatorial system; (4) those in the domes. The World Atlas of Sea
Surface Temperatures (U.S. Navy Hydrographic Office, 1944) gives
charts by months, from which each upwelling area can be identified and
its length and physical width determined ; the physical width was raised
by a factor of 2.5 to give some indication of the biological width of the
area, as described below. The seasonal distributions were worked out
by months and the total area of the upwelling system was estimated.
The areas of the more important upwelling systems are given by months
in Table I11 ; in the column labelled seasons the peak months of upwelling are underlined. This method was adequate for the major upwelling system but, for the lesser ones, more specialist publications were
consulted, as listed below. The column headed references includes
papers which describe the particular system.
I
45(
40
35
x
21
2(
I
I
I
I I
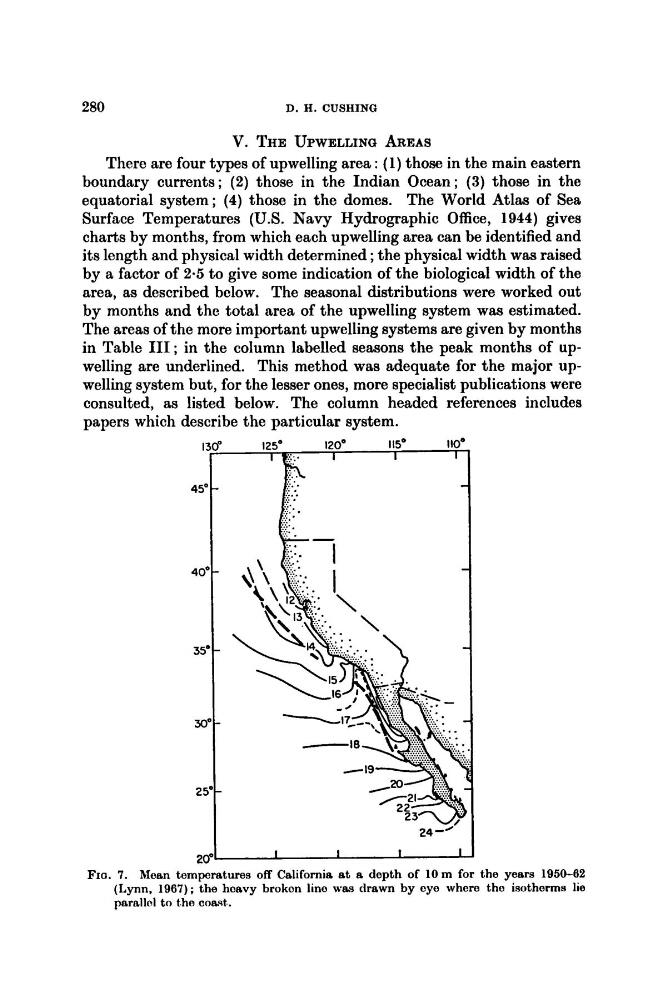
Fm. 7. Mean temperatures off California at a depth of 10m for the years 1950-62
(Lynn, 1967); the hcavy brokcn line was drawn by eye where tho isotherms lie
parallol to the coast,.
D. H. CUSHING
V. THE UPWELLING AREAS
There are four types of upwelling area : (1) those in the main eastern
boundary currents; (2) those in the Indian Ocean; (3) those in the
equatorial system; (4) those in the domes. The World Atlas of Sea
Surface Temperatures (U.S. Navy Hydrographic Office, 1944) gives
charts by months, from which each upwelling area can be identified and
its length and physical width determined ; the physical width was raised
by a factor of 2.5 to give some indication of the biological width of the
area, as described below. The seasonal distributions were worked out
by months and the total area of the upwelling system was estimated.
The areas of the more important upwelling systems are given by months
in Table I11 ; in the column labelled seasons the peak months of upwelling are underlined. This method was adequate for the major upwelling system but, for the lesser ones, more specialist publications were
consulted, as listed below. The column headed references includes
papers which describe the particular system.
I
45(
40
35
x
21
2(
I
I
I
I I
Fm. 7. Mean temperatures off California at a depth of 10m for the years 1950-62
(Lynn, 1967); the hcavy brokcn line was drawn by eye where tho isotherms lie
parallol to the coast,.