

176
E. D. 8. CORNER AND ANTHONY 0 . DAVIES
temperature readings were identical at both times. The vertical
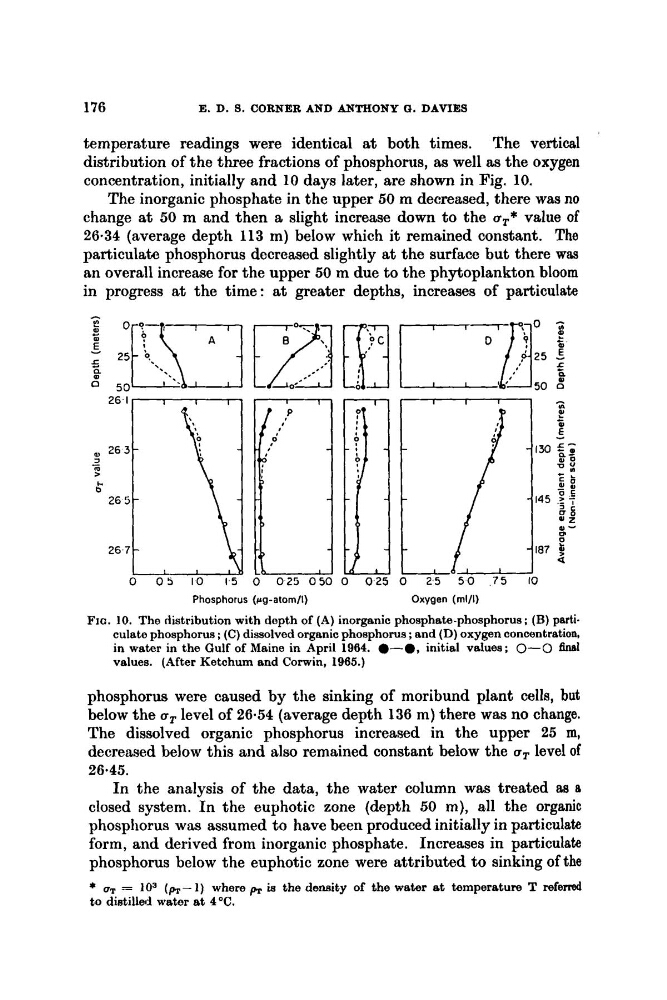
distribution of the three fractions of phosphorus, as well as the oxygen
concentration, initially and 10 days later, are shown in Fig. 10.
The inorganic phosphate in the upper 50 m decreased, there was no
change at 50 m and then a slight increase down to the uT* value of
26-34 (average depth 113 m) below which it remained constant. The
particulate phosphorus decreased slightly at the surface but there waa
an overall increase for the upper 50 m due to the phytoplankton bloom
in progress at the time: at greater depths, increases of particulate
0 1 0 2 5 050 1
0 0.25
Phosphorus (rg-atomll)
Oxygen (ml/l)
FIG. 10. The distribution with depth of (A) inorganic phosphate-phosphorus; (B) particulate phosphorus ; (C) dissolved organic phosphorus ; and (D) oxygen concentration,
in water in the Gulf of Maine in April 1964. 0-0, initial values; 0-0 fins1
values. (After Ketchum and Corwin, 1965.)
phosphorus were caused by the sinking of moribund plant cells, but
below the uT level of 26.54 (average depth 136 m) there was no change.
The dissolved organic phosphorus increased in the upper 25 m,
decreased below this and also remained constant below the uT level of
2645.
In the analysis of the data, the water column was treated aa a
closed system. In the euphotic zone (depth 50 m), all the organic
phosphorus was assumed to have been produced initially in particulate
form, and derived from inorganic phosphate. Increases in particulate
phosphorus below the euphotic zone were attributed t o sinking of the
* uT = lo3 (e- 1) where e is the density of the water at temperature T referred
to distilled water at 4°C.
E. D. 8. CORNER AND ANTHONY 0 . DAVIES
temperature readings were identical at both times. The vertical
distribution of the three fractions of phosphorus, as well as the oxygen
concentration, initially and 10 days later, are shown in Fig. 10.
The inorganic phosphate in the upper 50 m decreased, there was no
change at 50 m and then a slight increase down to the uT* value of
26-34 (average depth 113 m) below which it remained constant. The
particulate phosphorus decreased slightly at the surface but there waa
an overall increase for the upper 50 m due to the phytoplankton bloom
in progress at the time: at greater depths, increases of particulate
0 1 0 2 5 050 1
0 0.25
Phosphorus (rg-atomll)
Oxygen (ml/l)
FIG. 10. The distribution with depth of (A) inorganic phosphate-phosphorus; (B) particulate phosphorus ; (C) dissolved organic phosphorus ; and (D) oxygen concentration,
in water in the Gulf of Maine in April 1964. 0-0, initial values; 0-0 fins1
values. (After Ketchum and Corwin, 1965.)
phosphorus were caused by the sinking of moribund plant cells, but
below the uT level of 26.54 (average depth 136 m) there was no change.
The dissolved organic phosphorus increased in the upper 25 m,
decreased below this and also remained constant below the uT level of
2645.
In the analysis of the data, the water column was treated aa a
closed system. In the euphotic zone (depth 50 m), all the organic
phosphorus was assumed to have been produced initially in particulate
form, and derived from inorganic phosphate. Increases in particulate
phosphorus below the euphotic zone were attributed t o sinking of the
* uT = lo3 (e- 1) where e is the density of the water at temperature T referred
to distilled water at 4°C.