

60
GORDON A. RILEY
experiments using essentially the same kind of water but with no
harvesting procedure.
This experiment was repeated, using a surface sample taken from
the Slope Water area well offshore. Other samples from the same
collection were used for additional experiments of a comparative nature.
One of these was a 14-litre sample which was stored in a polyethylene
carboy. On alternate days 1 litre was removed and filtered for
carbon analysis, and the filtered water was then returned to the carboy.
Practically speaking, this approximated to a continuous yield experiment
but the daily rate of removal averaged only about 3.5% instead of 20%.
The third was a control carboy in which there was no cropping, but 1
litre was removed each week for carbon analysis, and the filtered water
was then discarded.
Preliminary filtration was carried out at sea, and the water stood
for five days before the experiment began. Initial experiment readings
were about 0-40 mg C/litre, and the concentrations declined as the
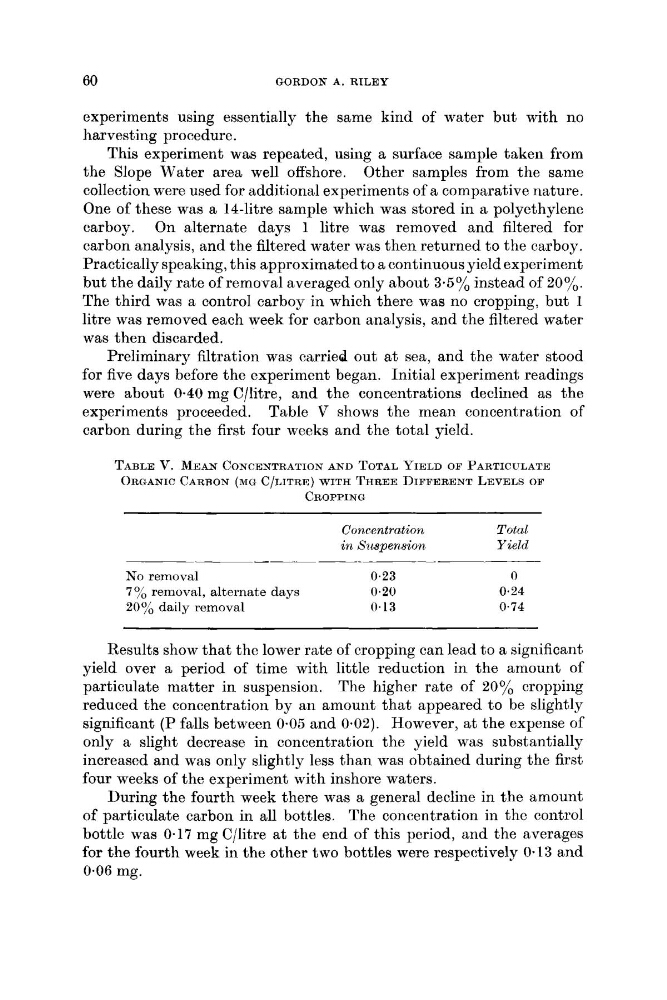
experiments proceeded. Table V shows the mean concentration of
carbon during the first four weeks and the total yield.
T A B L E v. MEAN CONCENTRATION AND TOTAL YIELD O F PARTICULATE
ORGANIC CARRON (MG C/LITRE) WITH THREE DIFFERENT LEVELS OF
CROPPING
Concentration
Total
in Suspension
Yield
No removal
0.23
0
776 removal, alternate days
0.20
0.24
20% daily removal
0.13
0.74
Results show that the lower rate of cropping can lead to a significant
yield over a period of time with little reduction in the amount of
particulate matter in suspension. The higher rate of 20% cropping
reduced the concentration by an amount that appeared to be slightly
significant (P falls between 0.05 and 0.02). However, at the expense of
only a slight decrease in concentration the yield was substantially
increased and was only slightly less than was obtained during the first
four weeks of the experiment with inshore waters.
During the fourth week there was a general decline in the amount
of particulate carbon in all bottles. The concentration in the control
bottle was 0.17 mg C/litre at the end of this period, and the averages
for the fourth week in the other two bottles were respectively 0.23 and
0.06 mg.
GORDON A. RILEY
experiments using essentially the same kind of water but with no
harvesting procedure.
This experiment was repeated, using a surface sample taken from
the Slope Water area well offshore. Other samples from the same
collection were used for additional experiments of a comparative nature.
One of these was a 14-litre sample which was stored in a polyethylene
carboy. On alternate days 1 litre was removed and filtered for
carbon analysis, and the filtered water was then returned to the carboy.
Practically speaking, this approximated to a continuous yield experiment
but the daily rate of removal averaged only about 3.5% instead of 20%.
The third was a control carboy in which there was no cropping, but 1
litre was removed each week for carbon analysis, and the filtered water
was then discarded.
Preliminary filtration was carried out at sea, and the water stood
for five days before the experiment began. Initial experiment readings
were about 0-40 mg C/litre, and the concentrations declined as the
experiments proceeded. Table V shows the mean concentration of
carbon during the first four weeks and the total yield.
T A B L E v. MEAN CONCENTRATION AND TOTAL YIELD O F PARTICULATE
ORGANIC CARRON (MG C/LITRE) WITH THREE DIFFERENT LEVELS OF
CROPPING
Concentration
Total
in Suspension
Yield
No removal
0.23
0
776 removal, alternate days
0.20
0.24
20% daily removal
0.13
0.74
Results show that the lower rate of cropping can lead to a significant
yield over a period of time with little reduction in the amount of
particulate matter in suspension. The higher rate of 20% cropping
reduced the concentration by an amount that appeared to be slightly
significant (P falls between 0.05 and 0.02). However, at the expense of
only a slight decrease in concentration the yield was substantially
increased and was only slightly less than was obtained during the first
four weeks of the experiment with inshore waters.
During the fourth week there was a general decline in the amount
of particulate carbon in all bottles. The concentration in the control
bottle was 0.17 mg C/litre at the end of this period, and the averages
for the fourth week in the other two bottles were respectively 0.23 and
0.06 mg.