

5 . VERTICAL DISTRIBUTION AND MIGRATION
165
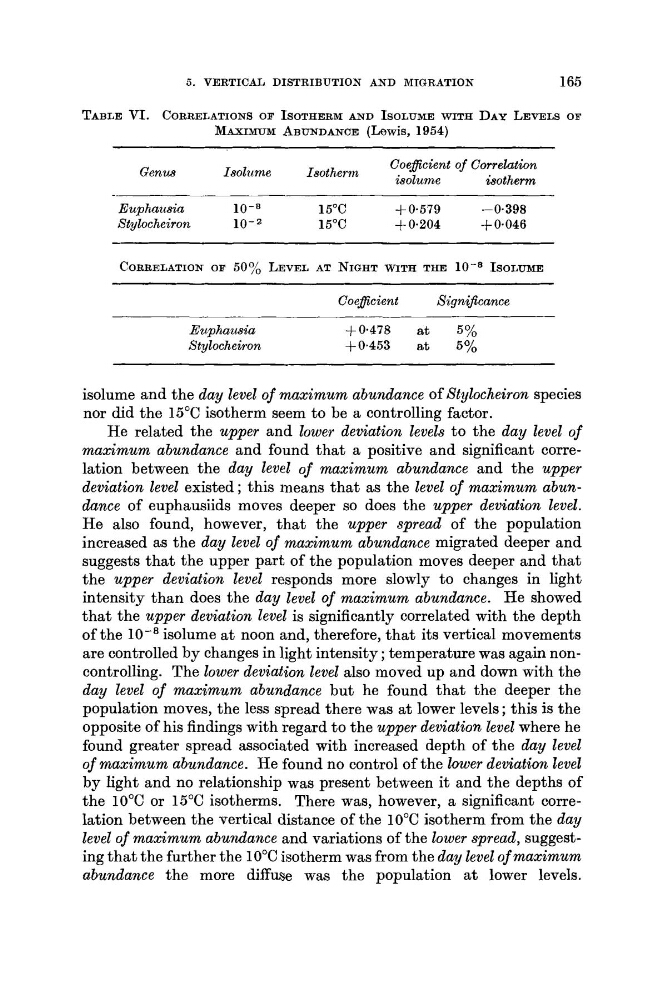
TABLE VI. CORRELATIONS OF ISOTHERM AND ISOLUME WITH DAY LEVELS OF
MAXIMTJM ABUNDANCE (Lewis, 1954)
Coeflcient of Correlation
Genus
Isolurne
Isotherm
isotherm
isolume
Euphausia
10-8
15°C
+0.579
-0.398
Stylocheiron
10-2
15°C
+ 0.204
-+ 0.046
CORRELATION OF 50% LEVEL AT NIGHT WITH TEE
ISOLUME
Coeficient
Significance
Euphausia
$0.478
at
5%
Stylocheiron
+0.453
at
5%
isolume and the day level of maximum abundance of Stylocheiron species
nor did the 15°C isotherm seem to be a controlling factor.
He related the upper and lower deviation levels to the day level of
maximum abundance and found that a positive and significant correlation between the day level of maximum abundance and the upper
deviation level existed ; this means that as the level of maximum abundance of euphausiids moves deeper so does the upper deviation level.
He also found, however, that the upper spread of the population
increased as the day level of maximurn abundance migrated deeper and
suggests that the upper part of the population moves deeper and that
the upper deviation level responds more slowly t o changes in light
intensity than does the day level of maximum abundance. He showed
that the upper deviation level is significantly correlated with the depth
of the lod8 isolume a t noon and, therefore, that its vertical movements
are controlled by changes in light intensity ; temperature was again noncontrolling. The lower deviation level also moved up and down with the
day level of maximum abundance but he found that the deeper the
population moves, the less spread there was a t lower levels ; this is the
opposite of his findings with regard to the upper deviation level where he
found greater spread associated with increased depth of the day level
of maximum abundance. He found no control of the lower deviation level
by light and no relationship was present between it and the depths of
the 10°C or 15°C isotherms. There was, however, a significant correlation between the vertical distance of the 10°C isotherm from the day
level of maximum abundance and variations of the lower spread, suggesting that the further the 10°C isotherm was from the day level of maximum
abundance the more diffuse was the population a t lower levels.
165
TABLE VI. CORRELATIONS OF ISOTHERM AND ISOLUME WITH DAY LEVELS OF
MAXIMTJM ABUNDANCE (Lewis, 1954)
Coeflcient of Correlation
Genus
Isolurne
Isotherm
isotherm
isolume
Euphausia
10-8
15°C
+0.579
-0.398
Stylocheiron
10-2
15°C
+ 0.204
-+ 0.046
CORRELATION OF 50% LEVEL AT NIGHT WITH TEE
ISOLUME
Coeficient
Significance
Euphausia
$0.478
at
5%
Stylocheiron
+0.453
at
5%
isolume and the day level of maximum abundance of Stylocheiron species
nor did the 15°C isotherm seem to be a controlling factor.
He related the upper and lower deviation levels to the day level of
maximum abundance and found that a positive and significant correlation between the day level of maximum abundance and the upper
deviation level existed ; this means that as the level of maximum abundance of euphausiids moves deeper so does the upper deviation level.
He also found, however, that the upper spread of the population
increased as the day level of maximurn abundance migrated deeper and
suggests that the upper part of the population moves deeper and that
the upper deviation level responds more slowly t o changes in light
intensity than does the day level of maximum abundance. He showed
that the upper deviation level is significantly correlated with the depth
of the lod8 isolume a t noon and, therefore, that its vertical movements
are controlled by changes in light intensity ; temperature was again noncontrolling. The lower deviation level also moved up and down with the
day level of maximum abundance but he found that the deeper the
population moves, the less spread there was a t lower levels ; this is the
opposite of his findings with regard to the upper deviation level where he
found greater spread associated with increased depth of the day level
of maximum abundance. He found no control of the lower deviation level
by light and no relationship was present between it and the depths of
the 10°C or 15°C isotherms. There was, however, a significant correlation between the vertical distance of the 10°C isotherm from the day
level of maximum abundance and variations of the lower spread, suggesting that the further the 10°C isotherm was from the day level of maximum
abundance the more diffuse was the population a t lower levels.