

REVIEW OF THE SYSTEMATICS AND ECOLOGY OF OCEANIC SQUIDS
253
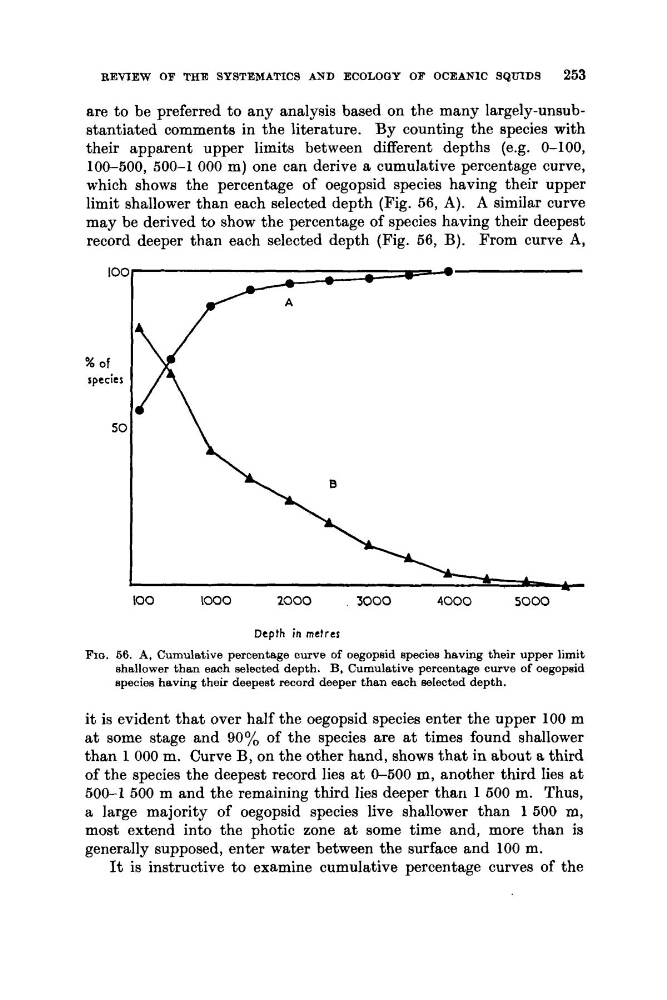
are to be preferred to any analysis based on the many largely-unsubstantiated comments in the literature. By counting the species with
their apparent upper limits between different depths (e.g. 0-100,
100-500, 500-1 000 m) one can derive a cumulative percentage curve,
which shows the percentage of oegopsid species having their upper
limit shallower than each selected depth (Fig. 56, A). A similar curve
may be derived to show the percentage of species having their deepest
record deeper than each selected depth (Fig. 56, B). From curve A,
100
1000
2000
3000
4000
so00
Depth in metres
Fro. 66. A, Cumulative percentage curve of oegopsid species having their upper limit
shallower than each selected depth. B, Cumulative percentage curve of oegopsid
species having their deepest record deeper than each selected depth.
it is evident that over half the oegopsid species enter the upper 100 m
a t some stage and 90% of the species are at times found shallower
than 1 000 m. Curve B, on the other hand, shows that in about a third
of the species the deepest record lies at 0-500 m, another third Iies at
500-1 500 m and the remaining third lies deeper than I 500 m. Thus,
a large majority of oegopsid species live shallower than I 5 0 0 m,
most extend into the photic zone at some time and, more than is
generally supposed, enter water between the surface and 100 m.
It is instructive to examine cumulative percentage curves of the
253
are to be preferred to any analysis based on the many largely-unsubstantiated comments in the literature. By counting the species with
their apparent upper limits between different depths (e.g. 0-100,
100-500, 500-1 000 m) one can derive a cumulative percentage curve,
which shows the percentage of oegopsid species having their upper
limit shallower than each selected depth (Fig. 56, A). A similar curve
may be derived to show the percentage of species having their deepest
record deeper than each selected depth (Fig. 56, B). From curve A,
100
1000
2000
3000
4000
so00
Depth in metres
Fro. 66. A, Cumulative percentage curve of oegopsid species having their upper limit
shallower than each selected depth. B, Cumulative percentage curve of oegopsid
species having their deepest record deeper than each selected depth.
it is evident that over half the oegopsid species enter the upper 100 m
a t some stage and 90% of the species are at times found shallower
than 1 000 m. Curve B, on the other hand, shows that in about a third
of the species the deepest record lies at 0-500 m, another third Iies at
500-1 500 m and the remaining third lies deeper than I 500 m. Thus,
a large majority of oegopsid species live shallower than I 5 0 0 m,
most extend into the photic zone at some time and, more than is
generally supposed, enter water between the surface and 100 m.
It is instructive to examine cumulative percentage curves of the