

342
CHARLES J. KREBS AND JUDITH H. MYERS
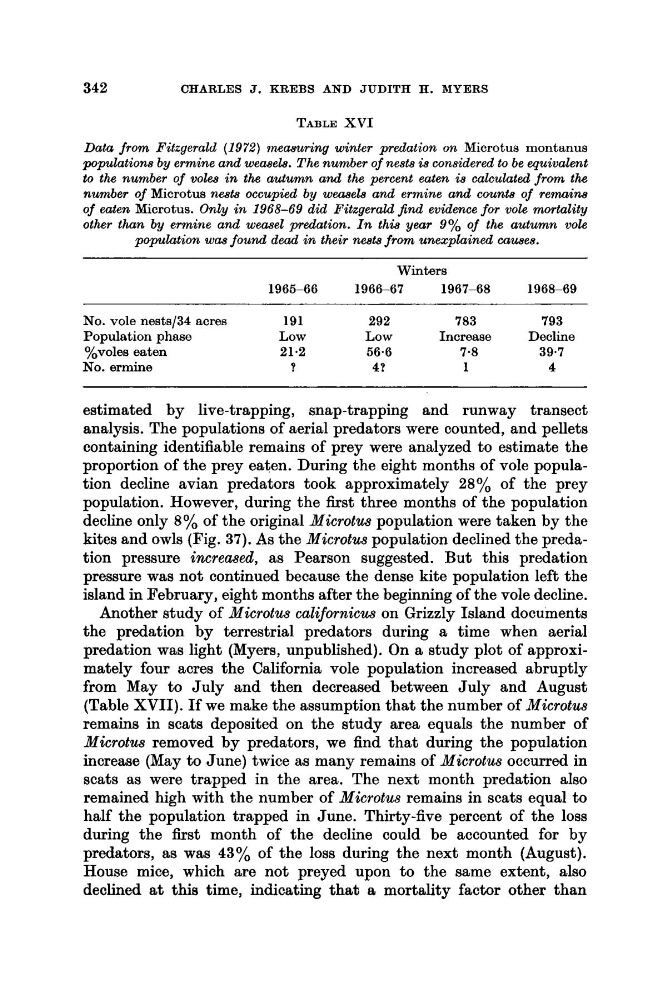
TABLE XVI
Data from Fitzgerald (1972) vrmwuring winter predation on Microtus montanus
populations by ermine and weasel. The number of nests is considered to be equivalent
to the number of voles i n the autumn and the percent eaten is calculated from the
number of Microtus nests occupied by weasels and ermine and count8 of remaim
of eaten Microtus. Only in 1968-69 did Fitzgerald jind evidence for vole mortality
other than by ermine and weasel predation. I n this year 9% of the autumn vole
population was found dead in their nests from unexplained cauaes.
Winters
19 65-6 6
1966-67
1967-68
1968-69
No. vole nests/34 acres
191
292
783
793
yovoles eaten
21.2
56.6
7.8
39.7
Population phase
Low
Low
Increase
Decline
No. ermine
?
4P
1
4
estimated by live-trapping, snap-trapping and runway transect
analysis. The populations of aerial predators were counted, and pellets
containing identifiable remains of prey were analyzed to estimate the
proportion of the prey eaten. During the eight months of vole population decline avian predators took approximately 28% of the prey
population. However, during the first three months of the population
decline only 8% of the original Microtw population were taken by the
kites and owls (Fig. 37). As the Microtus population declined the predation pressure increased, as Pearson suggested. But this predation
pressure was not continued because the dense kite population left the
island in February, eight months after the beginning of the vole decline.
Another study of Microtw californicus on Grizzly Island documents
the predation by terrestrial predators during a time when aerial
predation was light (Myers, unpublished). On a study plot of approximately four acres the California vole population increased abruptly
from May to July and then decreased between July and August
(Table XVII). If we make the assumption that the number of Microtus
remains in scats deposited on the study area equals the number of
Microtus removed by predators, we find that during the population
increase (May to June) twice as many remains of Microtus occurred in
scats as were trapped in the area. The next month predation also
remained high with the number of Microtus remains in scats equal to
half the population trapped in June. Thirty-five percent of the loss
during the first month of the decline could be accounted for by
predators, as was 43% of the loss during the next month (August).
House mice, which are not preyed upon to the same extent, also
declined at this time, indicating that a mortality factor other than
CHARLES J. KREBS AND JUDITH H. MYERS
TABLE XVI
Data from Fitzgerald (1972) vrmwuring winter predation on Microtus montanus
populations by ermine and weasel. The number of nests is considered to be equivalent
to the number of voles i n the autumn and the percent eaten is calculated from the
number of Microtus nests occupied by weasels and ermine and count8 of remaim
of eaten Microtus. Only in 1968-69 did Fitzgerald jind evidence for vole mortality
other than by ermine and weasel predation. I n this year 9% of the autumn vole
population was found dead in their nests from unexplained cauaes.
Winters
19 65-6 6
1966-67
1967-68
1968-69
No. vole nests/34 acres
191
292
783
793
yovoles eaten
21.2
56.6
7.8
39.7
Population phase
Low
Low
Increase
Decline
No. ermine
?
4P
1
4
estimated by live-trapping, snap-trapping and runway transect
analysis. The populations of aerial predators were counted, and pellets
containing identifiable remains of prey were analyzed to estimate the
proportion of the prey eaten. During the eight months of vole population decline avian predators took approximately 28% of the prey
population. However, during the first three months of the population
decline only 8% of the original Microtw population were taken by the
kites and owls (Fig. 37). As the Microtus population declined the predation pressure increased, as Pearson suggested. But this predation
pressure was not continued because the dense kite population left the
island in February, eight months after the beginning of the vole decline.
Another study of Microtw californicus on Grizzly Island documents
the predation by terrestrial predators during a time when aerial
predation was light (Myers, unpublished). On a study plot of approximately four acres the California vole population increased abruptly
from May to July and then decreased between July and August
(Table XVII). If we make the assumption that the number of Microtus
remains in scats deposited on the study area equals the number of
Microtus removed by predators, we find that during the population
increase (May to June) twice as many remains of Microtus occurred in
scats as were trapped in the area. The next month predation also
remained high with the number of Microtus remains in scats equal to
half the population trapped in June. Thirty-five percent of the loss
during the first month of the decline could be accounted for by
predators, as was 43% of the loss during the next month (August).
House mice, which are not preyed upon to the same extent, also
declined at this time, indicating that a mortality factor other than