

340
CHARLES J. KREBS AND JUDITH H . MYERS
hunting area to Brant’s study area. If the latter were the case, more
Microtus remains would be deposited on the area than were removed
from the area.
The most intensive work on predation has been done on Microtus
californicus by Pearson (1964, 1966, 1971). The technique of scat
analysis was used by Pearson to measure the impact of terrestrial
predators on M . californicus populations for parts of three population
fluctuations. An assumption underlying this technique is that predator
droppings are not concentrated on the study area. The best estimates
of the proportion of the Microtus population taken by predators was
obtained during the population decline, when reproduction by the
Microtus population was reduced or had ceased altogether. The vole
population can be estimated at the end of the breeding season and the
number of individuals taken from this “standing crop” by the predators
determined. As indicated in Table XIV, the percentage of the Microtus
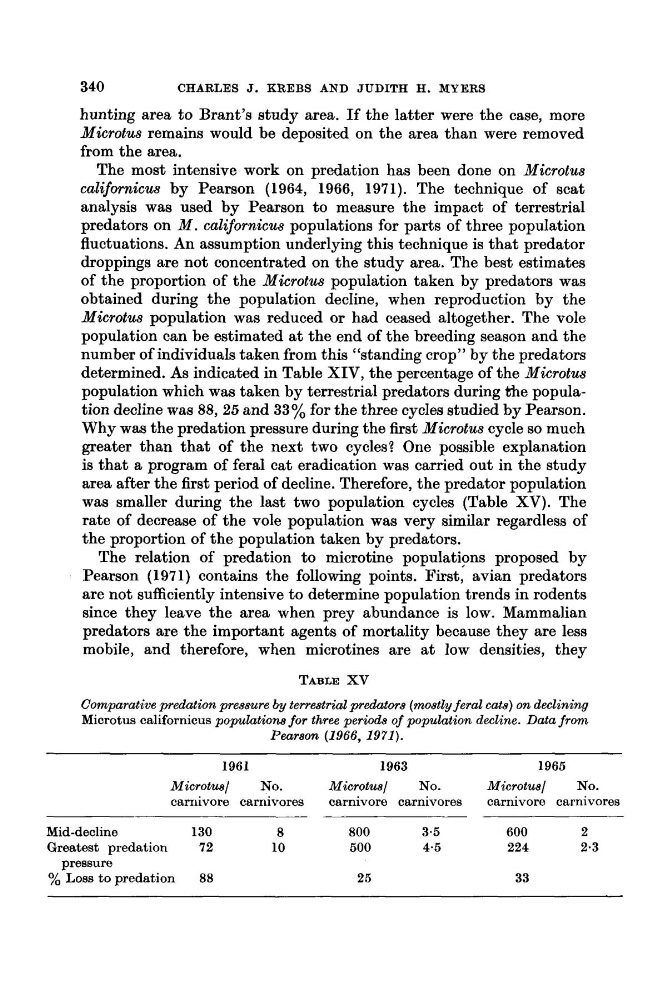
population which was taken by terrestrial predators during the population decline was 88, 25 and 33% for the three cycles studied by Pearson.
Why was the predation pressure during the first Microtus cycle so much
greater than that of the next two cycles? One possible explanation
is that a program of feral cat eradication was carried out in the study
area after the first period of decline. Therefore, the predator population
was smaller during the last two population cycles (Table XV). The
rate of decrease of the vole population was very similar regardless of
the proportion of the population taken by predators.
The relation of predation to microtine populations proposed by
Pearson (197 1) contains the following points. First, avian predators
are not sufficiently intensive to determine population trends in rodents
since they leave the area when prey abundance is low. Mammalian
predators are the important agents of mortality because they are less
mobile, and therefore, when microtines are at low densities, they
TABLE X V
Comparative predation pressure by terrestrial predators (mostly feral cats) on declining
Microtus californicus population8 for three periods of population decline. Data front
Pearson (1966, 1971).
1961
1963
1965
Microtusl
No.
Microtwl
No.
Microtwl
No.
carnivore carnivores
carnivore carnivores
carnivore carnivores
Mid-decline
130
8
800
3.5
600
2
Greatest predation
72
10
500
4-5
224
2.3
pressure
yo Loss to predation 88
25
33
CHARLES J. KREBS AND JUDITH H . MYERS
hunting area to Brant’s study area. If the latter were the case, more
Microtus remains would be deposited on the area than were removed
from the area.
The most intensive work on predation has been done on Microtus
californicus by Pearson (1964, 1966, 1971). The technique of scat
analysis was used by Pearson to measure the impact of terrestrial
predators on M . californicus populations for parts of three population
fluctuations. An assumption underlying this technique is that predator
droppings are not concentrated on the study area. The best estimates
of the proportion of the Microtus population taken by predators was
obtained during the population decline, when reproduction by the
Microtus population was reduced or had ceased altogether. The vole
population can be estimated at the end of the breeding season and the
number of individuals taken from this “standing crop” by the predators
determined. As indicated in Table XIV, the percentage of the Microtus
population which was taken by terrestrial predators during the population decline was 88, 25 and 33% for the three cycles studied by Pearson.
Why was the predation pressure during the first Microtus cycle so much
greater than that of the next two cycles? One possible explanation
is that a program of feral cat eradication was carried out in the study
area after the first period of decline. Therefore, the predator population
was smaller during the last two population cycles (Table XV). The
rate of decrease of the vole population was very similar regardless of
the proportion of the population taken by predators.
The relation of predation to microtine populations proposed by
Pearson (197 1) contains the following points. First, avian predators
are not sufficiently intensive to determine population trends in rodents
since they leave the area when prey abundance is low. Mammalian
predators are the important agents of mortality because they are less
mobile, and therefore, when microtines are at low densities, they
TABLE X V
Comparative predation pressure by terrestrial predators (mostly feral cats) on declining
Microtus californicus population8 for three periods of population decline. Data front
Pearson (1966, 1971).
1961
1963
1965
Microtusl
No.
Microtwl
No.
Microtwl
No.
carnivore carnivores
carnivore carnivores
carnivore carnivores
Mid-decline
130
8
800
3.5
600
2
Greatest predation
72
10
500
4-5
224
2.3
pressure
yo Loss to predation 88
25
33